Learn How To Insert Bar Chart In PowerPoint In 6 Quick Steps!
Mar 11, 2023
Have you ever wanted to add a bar chart to your PowerPoint presentation but don't know how?
Today, we'll teach you how to insert a bar chart in PowerPoint. We'll even show you the importance of using a bar chart in creating compelling business presentations!
In this article, we will discuss the following:
-
Inserting a bar chart in PowerPoint
-
Customizing your bar chart
-
Adding chart elements
-
Frequently asked questions about how to insert a bar chart in PowerPoint
How to Add Bar Charts in PowerPoint Presentation.
Inserting a bar chart in PowerPoint.
To add a bar chart to your PowerPoint presentation, you need to do the following:
-
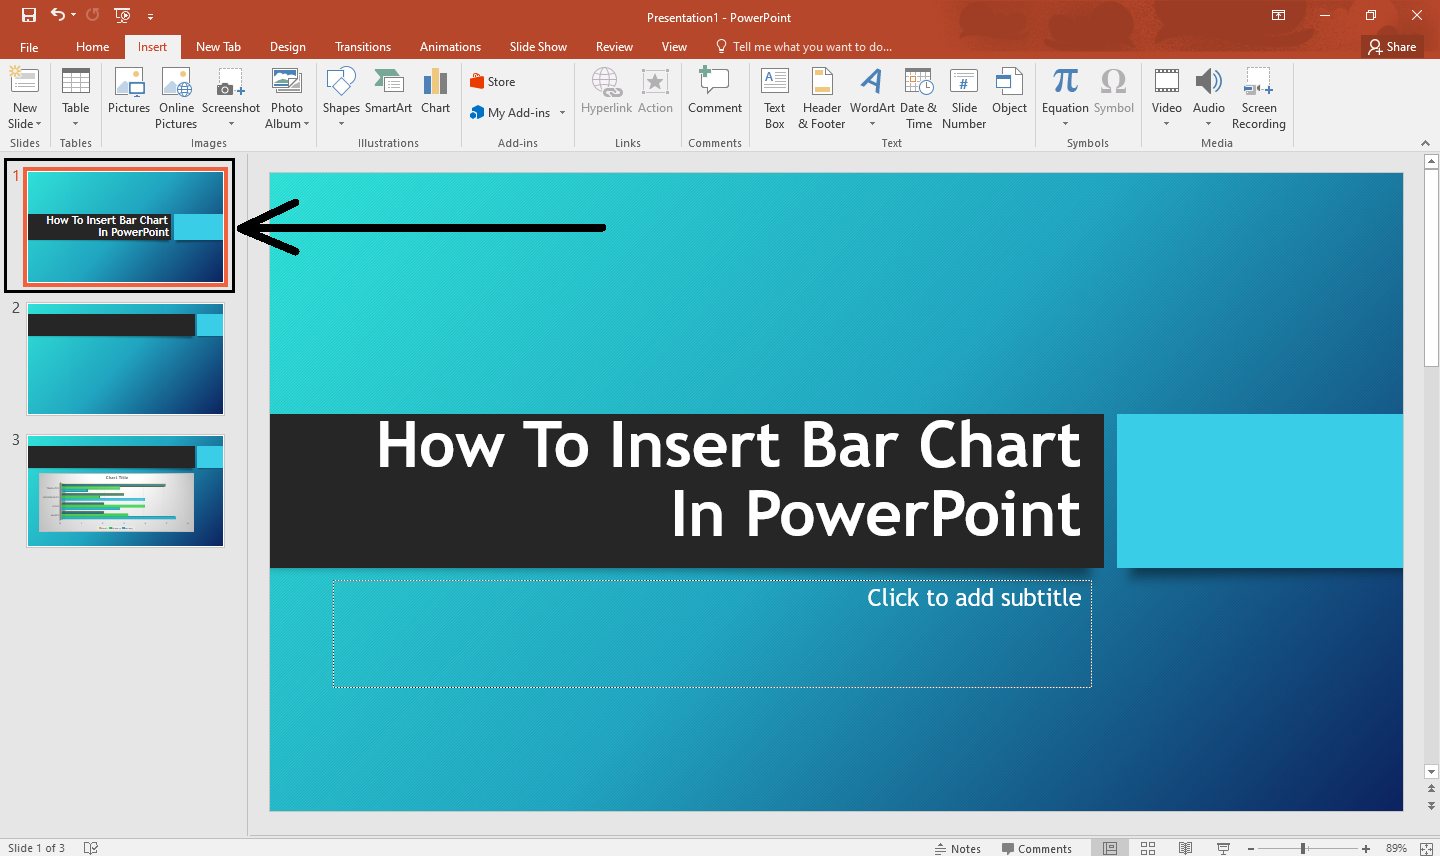
Open your Microsoft PowerPoint presentation.
-
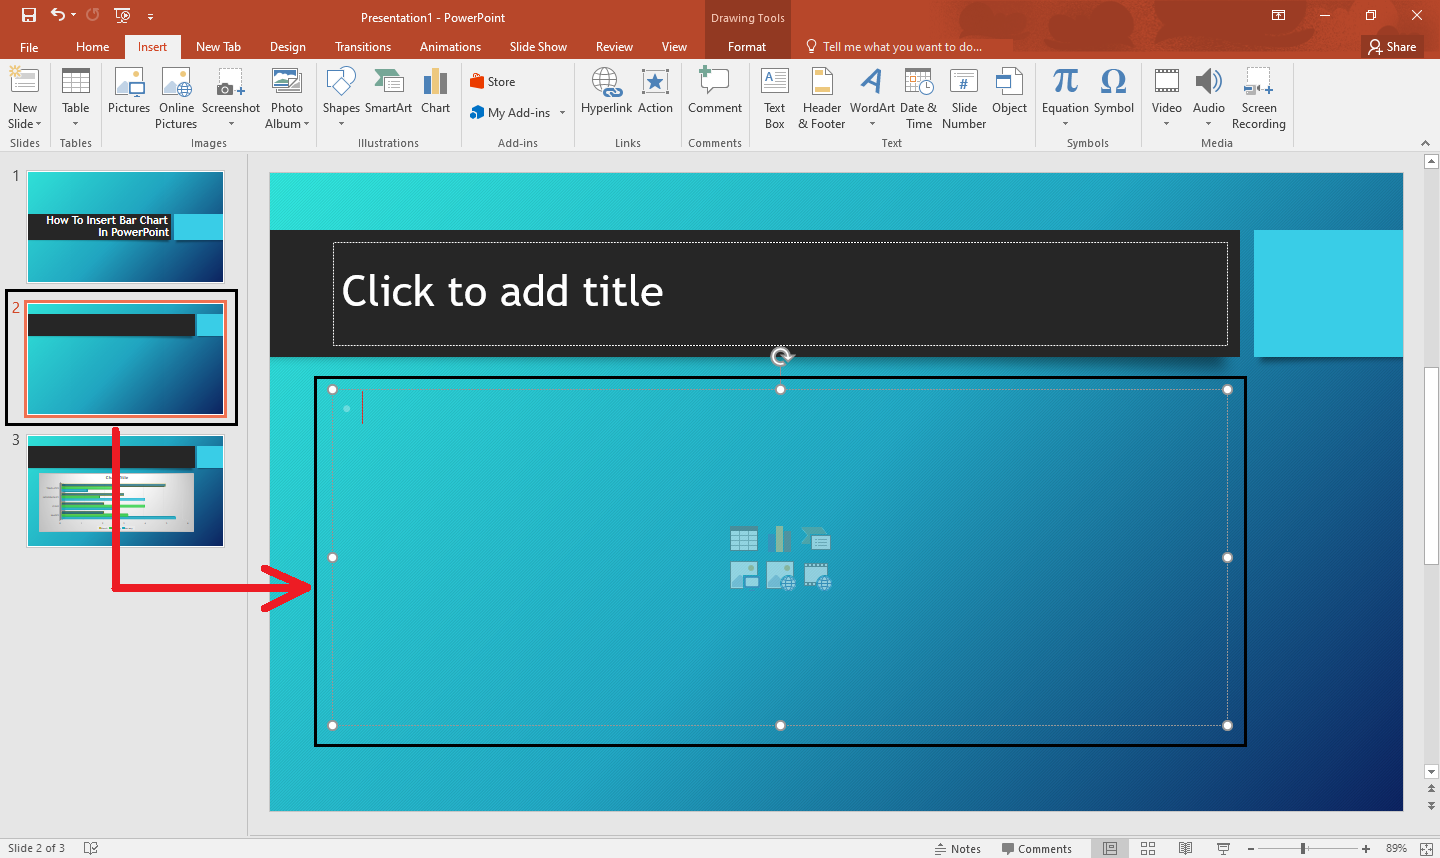
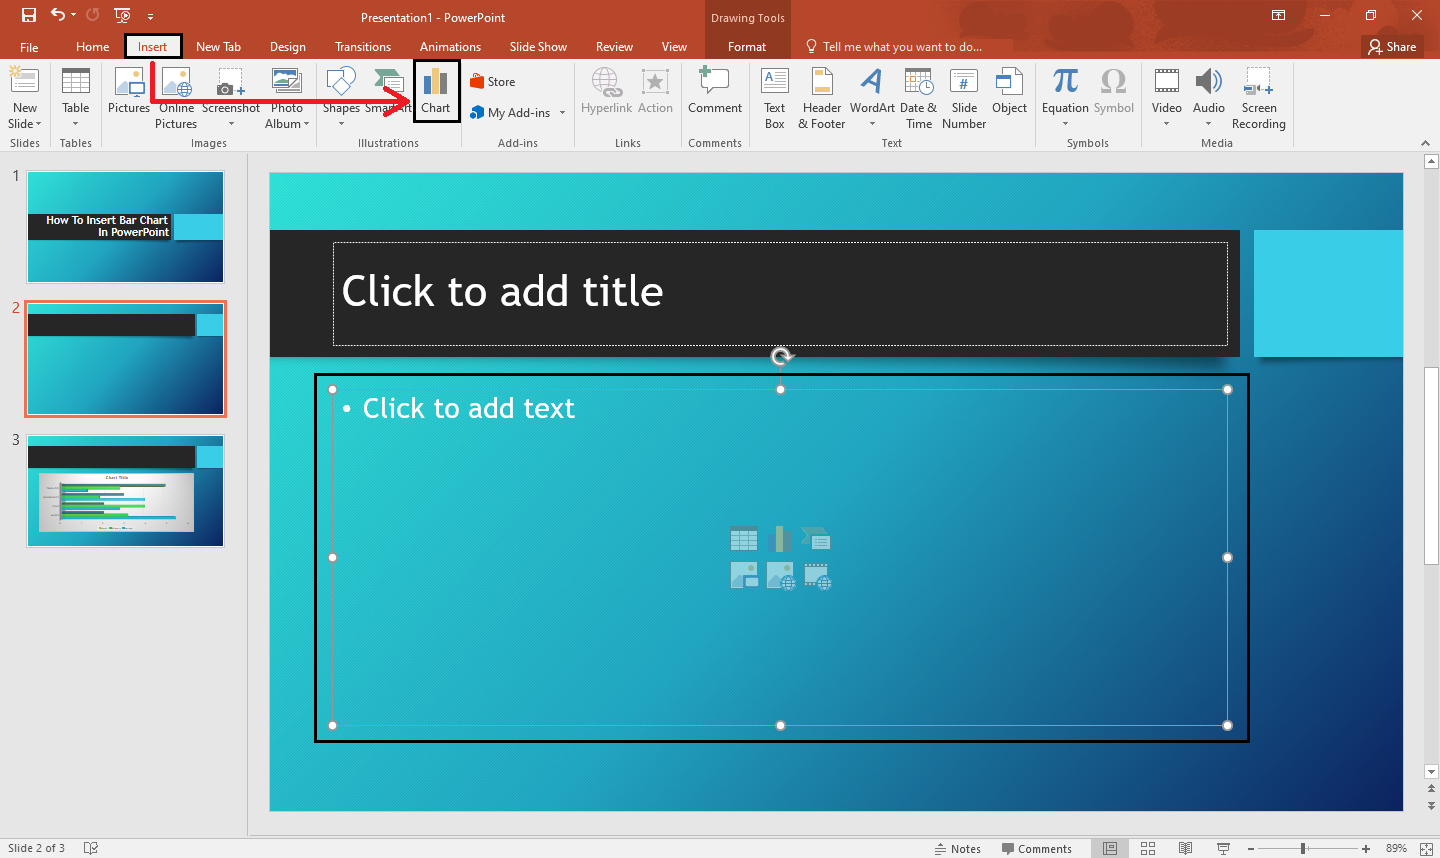
Select a blank slide in your presentation, then click a placeholder text box where you want to insert a bar chart.
-
Go to the "Insert" tab, then click the "Chart" icon.
-
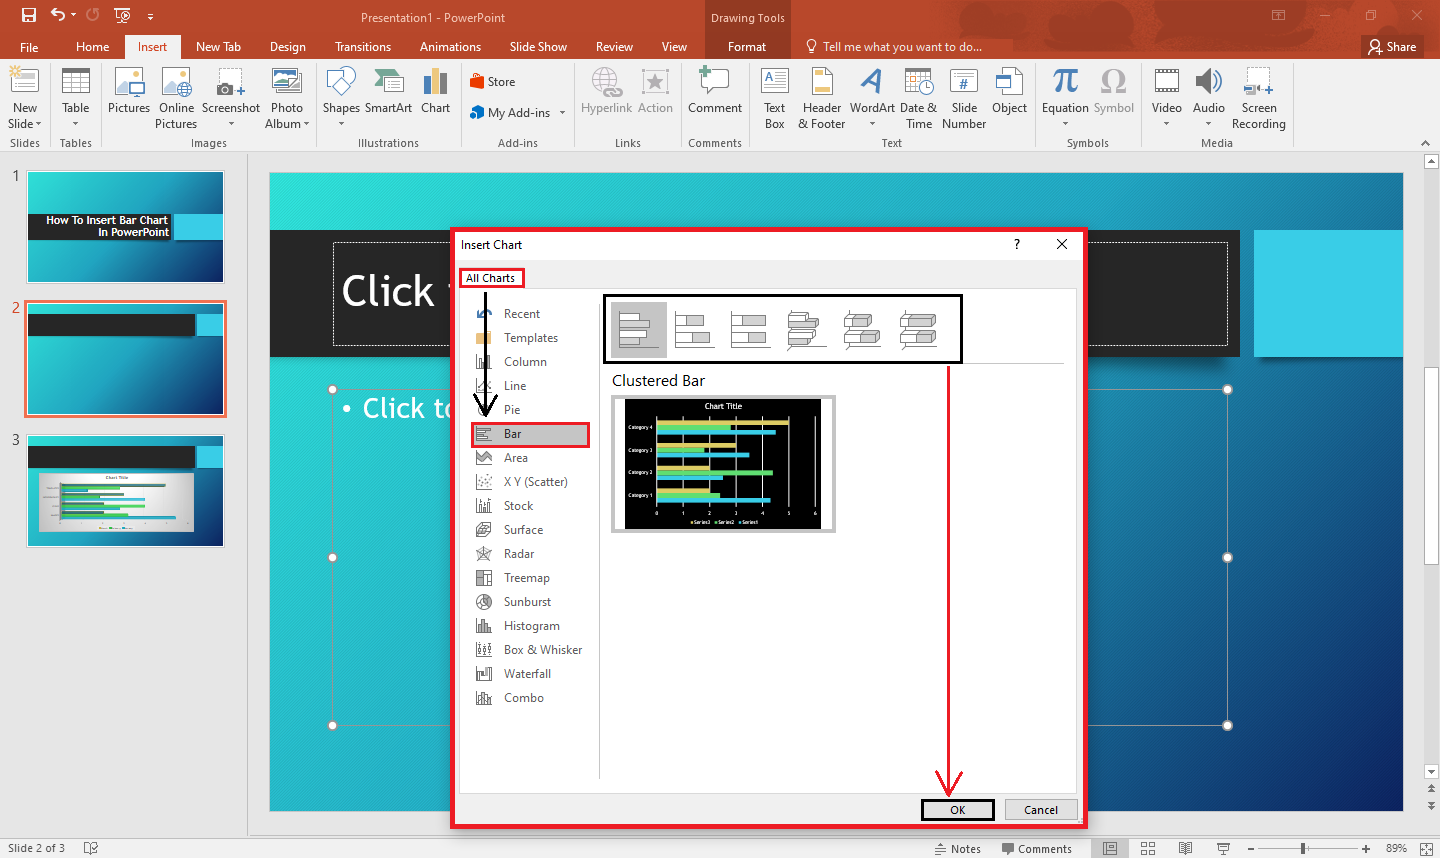
Select a chart type for your PowerPoint presentation in the "Insert Chart" dialog box. In our example, we will click "bar chart."

-
Select a bar chart template and click "OK."
-
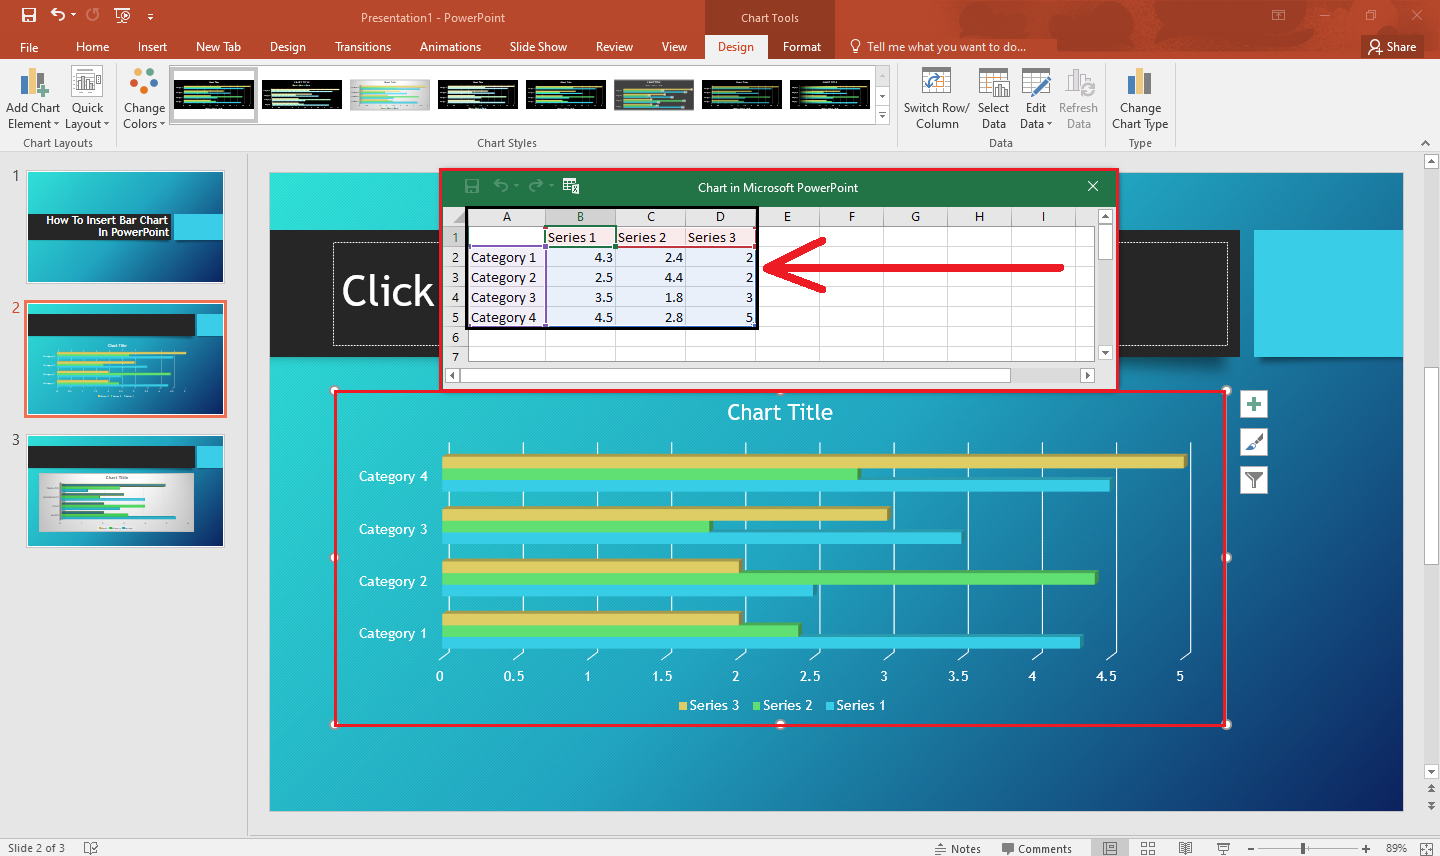
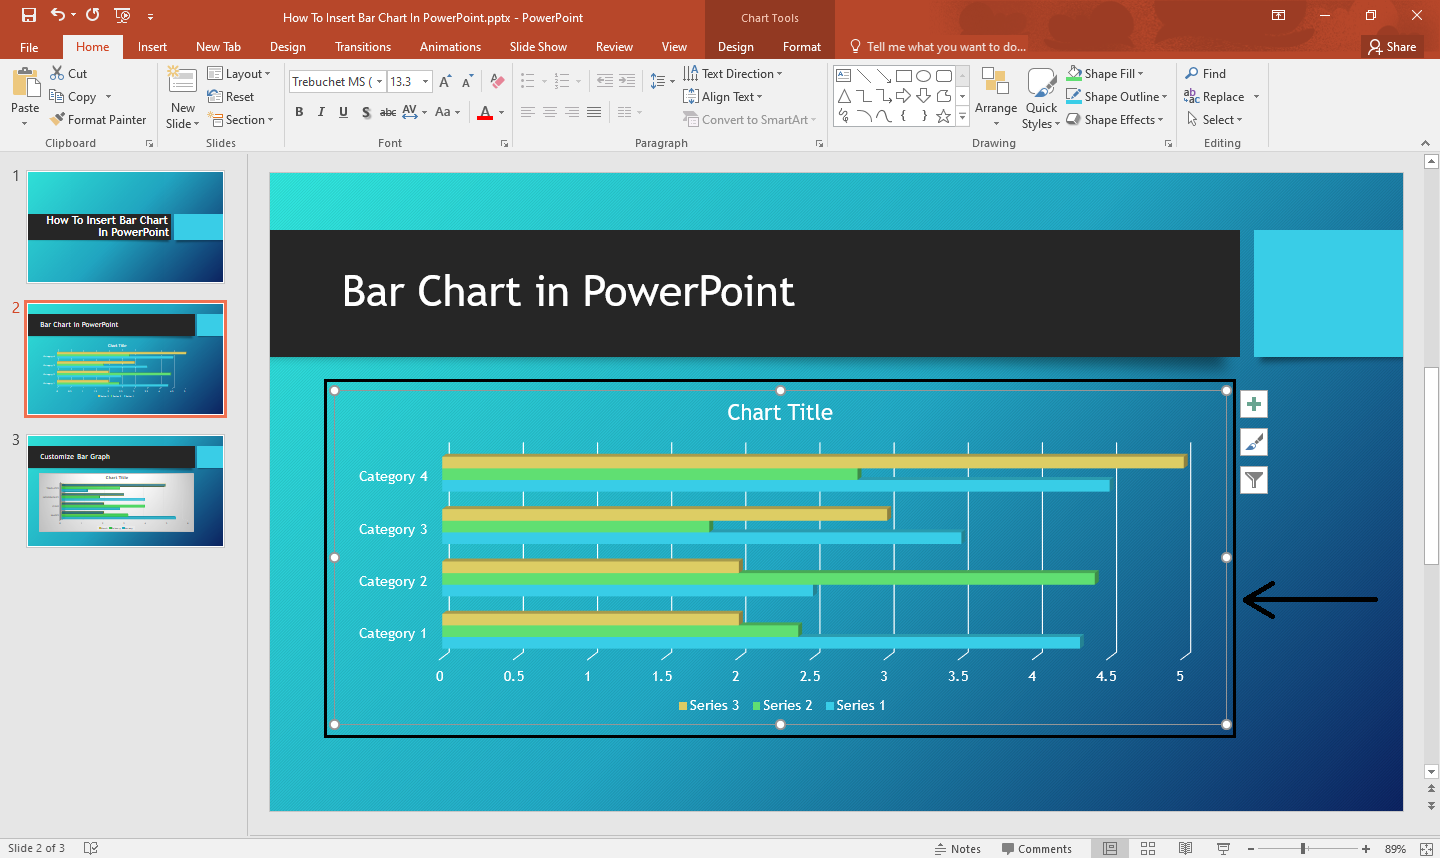
Once your bar chart appears on a specific PowerPoint slide, type your data in the pop-up spreadsheet.
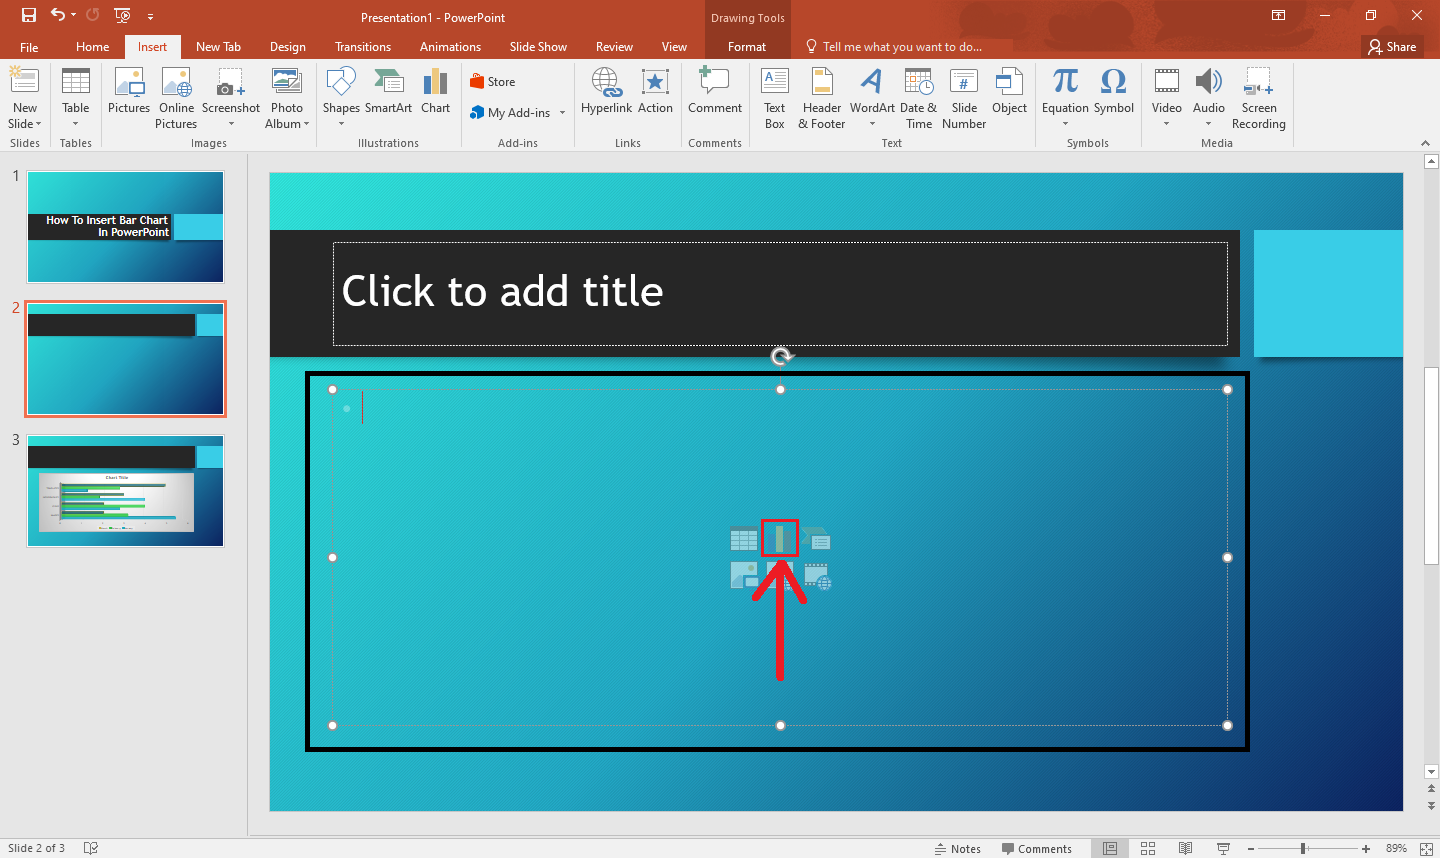
Tip: You can also click the "Chart Icon" directly in the text box of a specific PowerPoint slide.
Customize your bar chart.
Let's say you want to customize your bar chart in your PowerPoint presentation to create consistent visuals. All you need to do is:
-
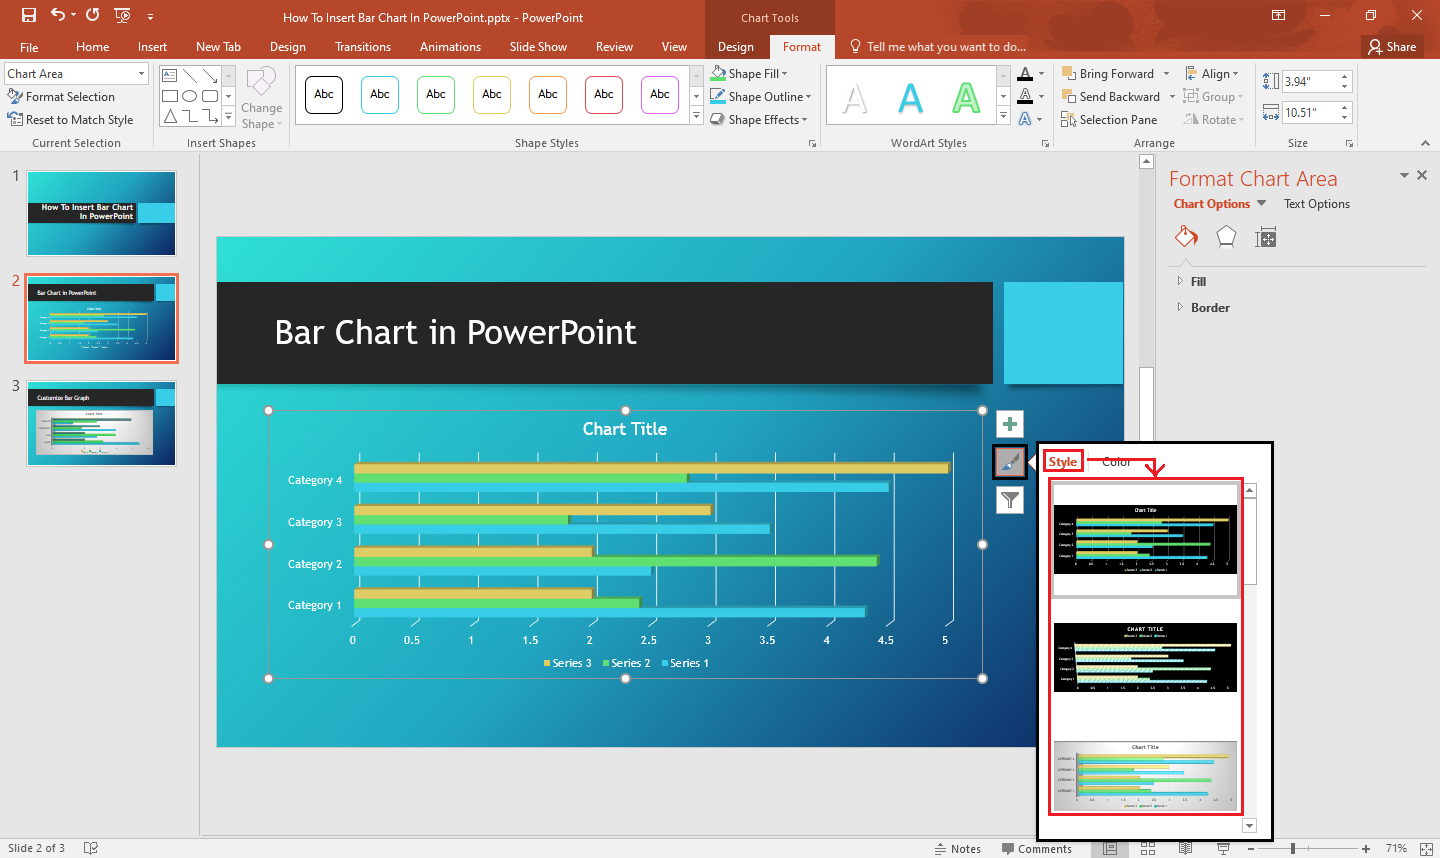
Select the box line of your bar chart.
-
In the right corner of the chart, click "Chart Styles." Select a specific style for your chart from the drop-down menu.
-
Once you've done that, your selected styles will appear on your slide.
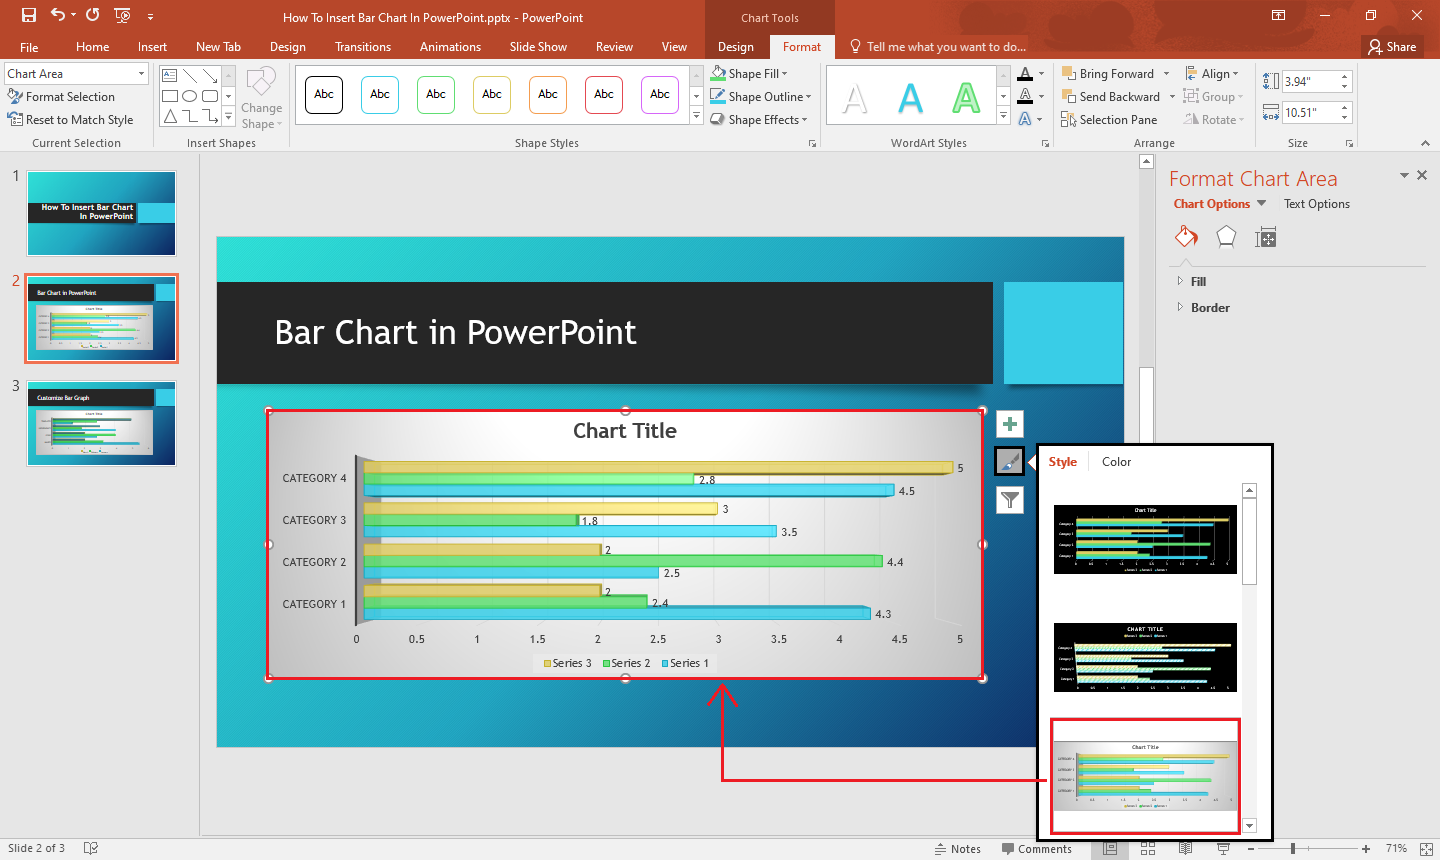
You can also change your chart's color, effect, and series options by accessing "Format Data Series" in the right corner of your PowerPoint presentation.
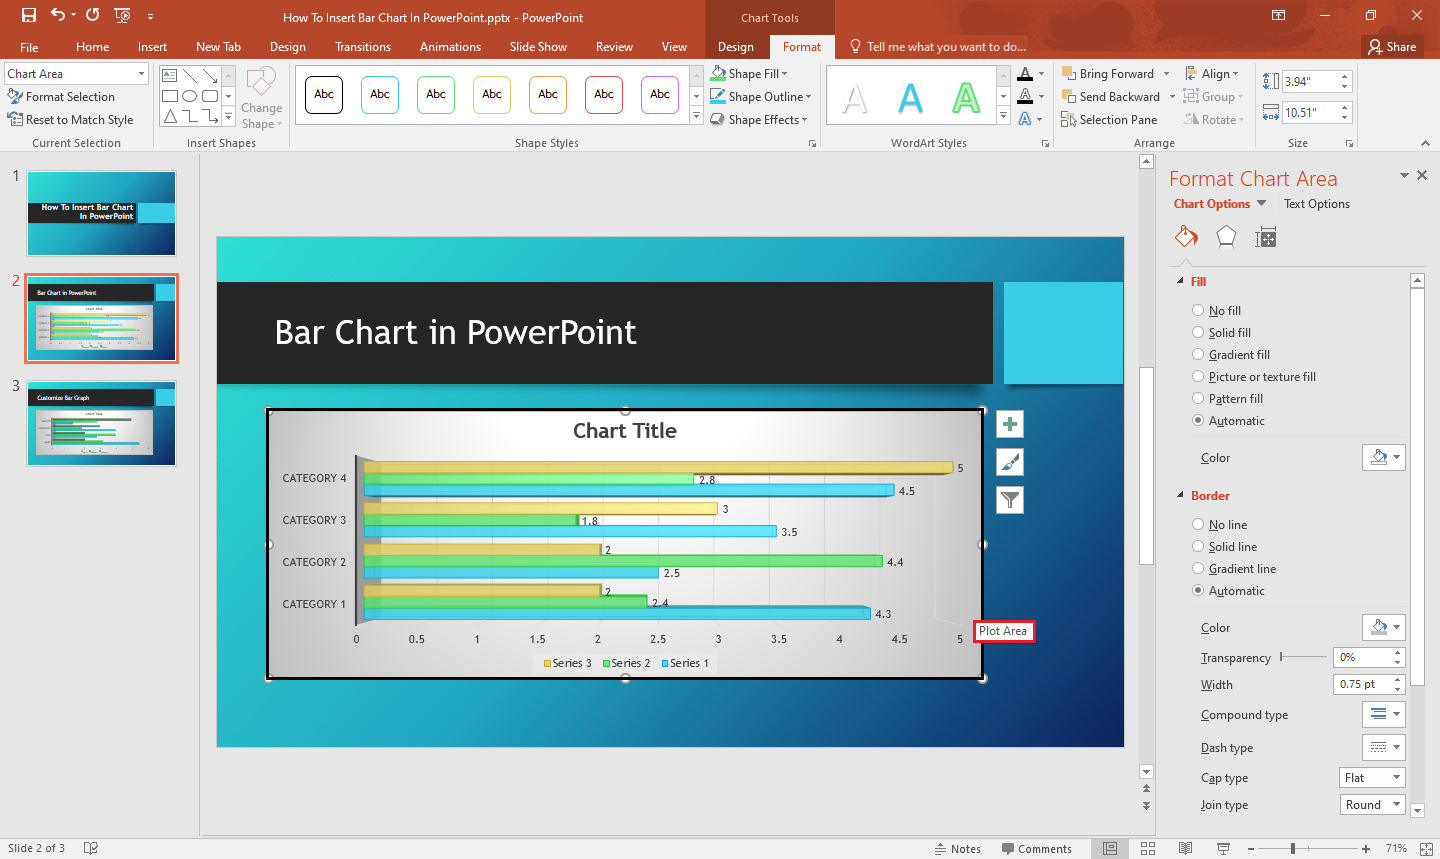
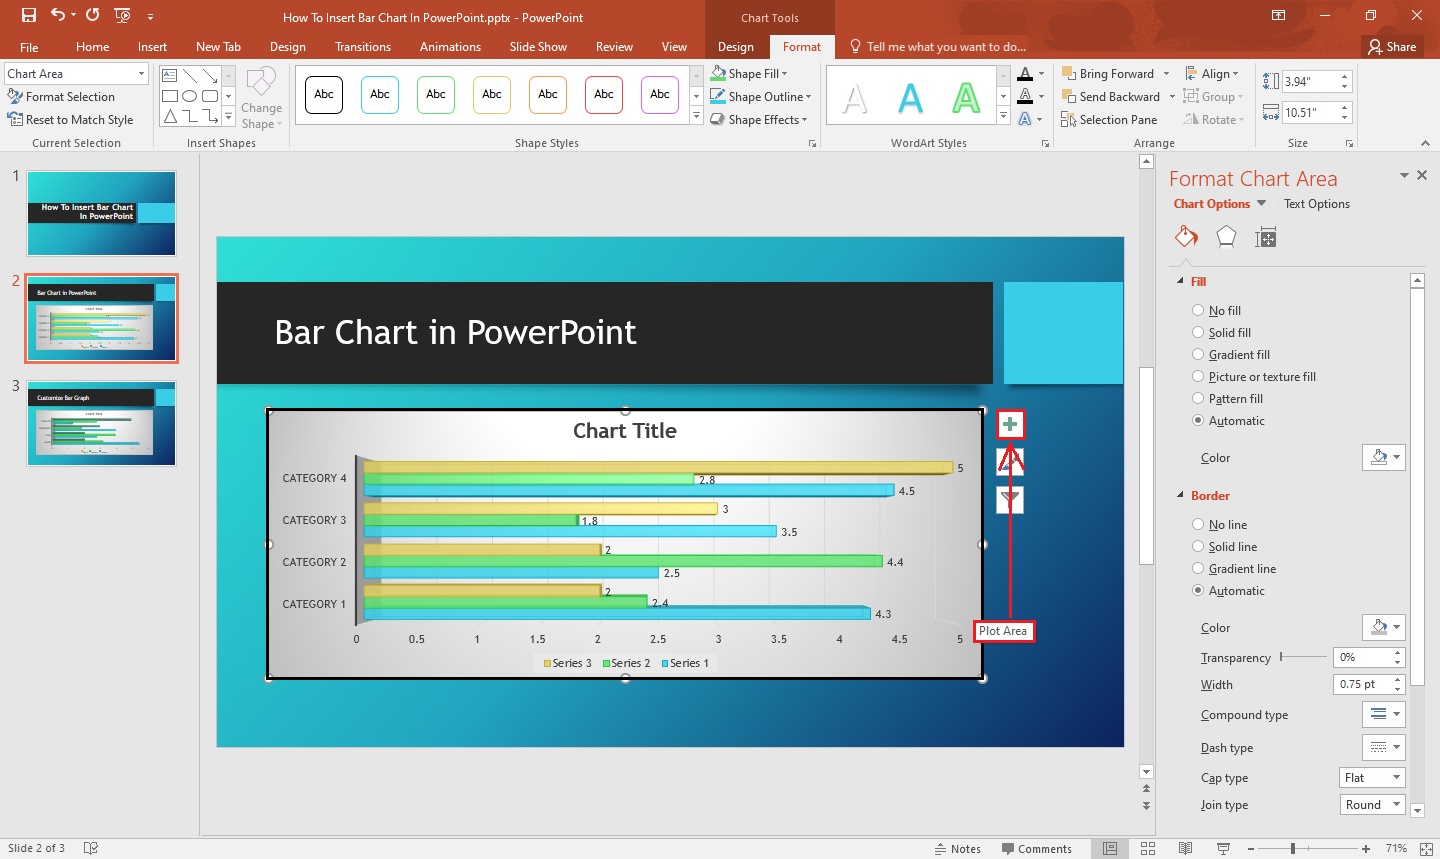
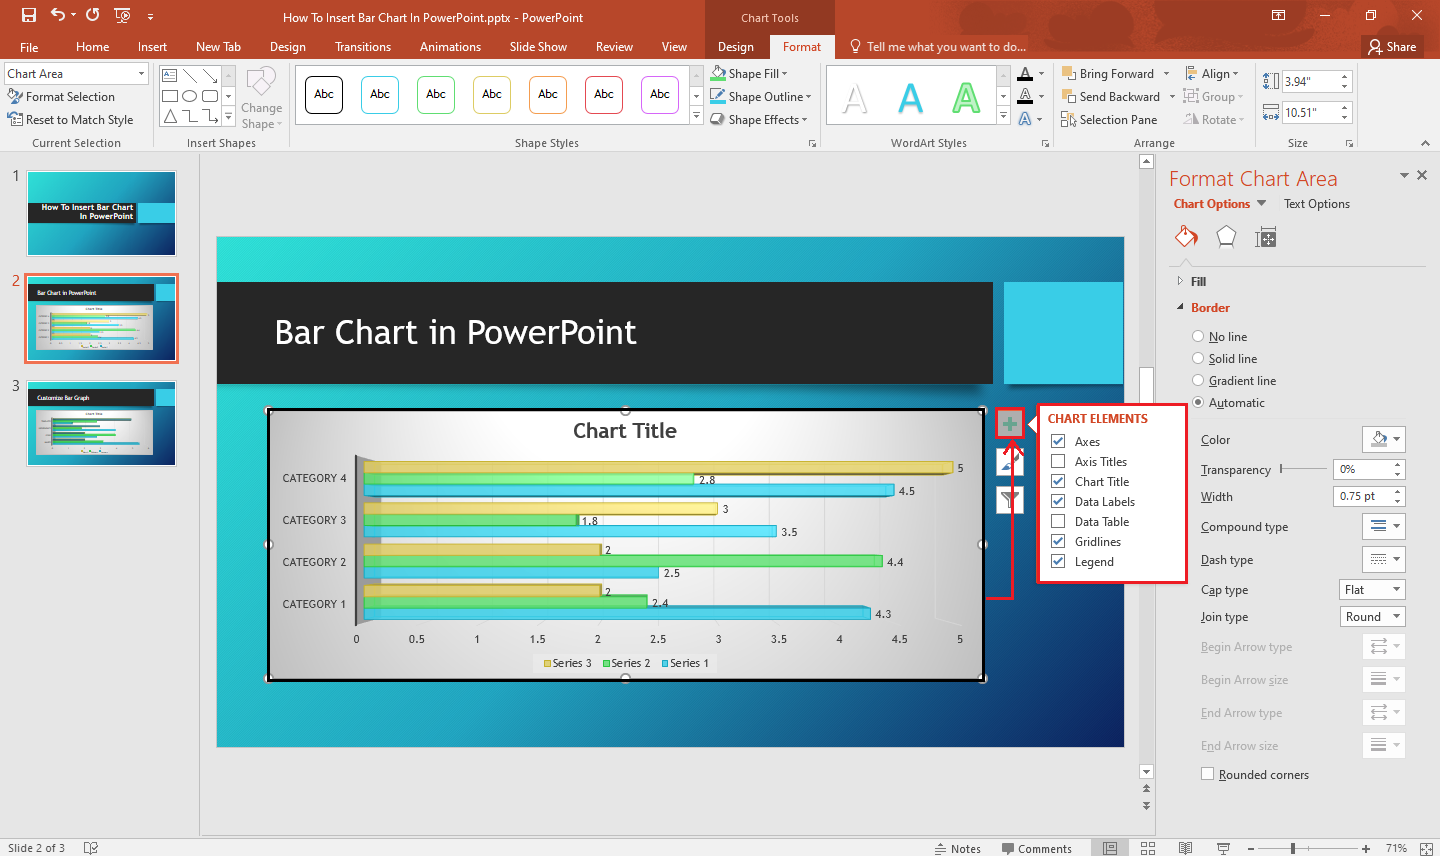
Add chart elements.
If you want to insert more chart elements into your data presentation on PowerPoint, you need to follow this:
-
Click the "Chart" icon in your PowerPoint presentation.
-
Click the "Plus" sign icon in the right corner of your chart.
-
Select the chart elements you want to add.
Final Thoughts on How to Insert a Bar Chart in PowerPoint.
If you want to add a bar graph to your PowerPoint file, follow the steps above. Our tips should also help you customize your data.
For more premium PowerPoint graphs and templates, visit Simple Slides. Access 10,000+ slides, infographics, and professional-looking templates for your presentation!
Frequently asked questions about how to insert a bar chart in PowerPoint:
What are the different chart types available in PowerPoint presentations?
There are fifteen different chart types available in PowerPoint presentations:
- Column charts
- Line charts
- Pie charts
- Bar charts
- Area charts
- X-Y (scatter) charts
- Stock charts
- Surface charts
- Radar charts
- Treemap charts
- Sunburst charts
- Histogram charts
- Box & Whisker
- Waterfall charts
- Combo (combination) charts
How many chart templates are there in the bar chart?
Six bar chart templates are available when you choose a bar chart in the "Insert chart" templates
- Clustered bar charts
- Stacked bar charts
- 100% stacked bar charts
- The 3D clustered bar chart
- The 3D stacked bar chart
- 3D 100% clustered bar chart
What are the benefits of using bar charts in PowerPoint?
The following are the advantages of using a bar chart in PowerPoint presentations:
-
Displaying a frequency distribution for each category of data
-
Showing the proportions or relative sizes of several categories
-
Providing a graphic summary of an extensive data collection
-
Estimating important values quickly
Related Articles:
How to Remove Animation From PowerPoint Presentations
Get A Free Sample of Our Award-Winning PowerPoint Templates + University
Get A Free Sample of Our Award-Winning PowerPoint Templates + University
Join our mailing list to receive the latest news and updates from our team.
Don't worry, your information will not be shared.
We hate SPAM. We will never sell your information, for any reason.