
Discover How To Insert Bar Chart In Google Slides
Mar 11, 2023
Do you want to know how to add bar charts to your Google Slides presentation?
Lucky you because we'll show you how to insert charts into your Google Slides presentation! This way, you can enjoy the benefits of bar graphs in creating concise and compelling reports.
In this article, we will go through the following:
-
Inserting a bar chart in your Google Slides presentation
-
Inputting and editing the chart according to your data range
-
Customizing your bar graph in Google Slides
-
Answering frequently asked questions about how to add bar graphs in Google Slides
Adding Bar Charts in Google Slides: Everything You Need to Know!
Insert a bar chart in your Google Slides presentation.
To insert a bar chart into Google Slides, follow these steps:
-
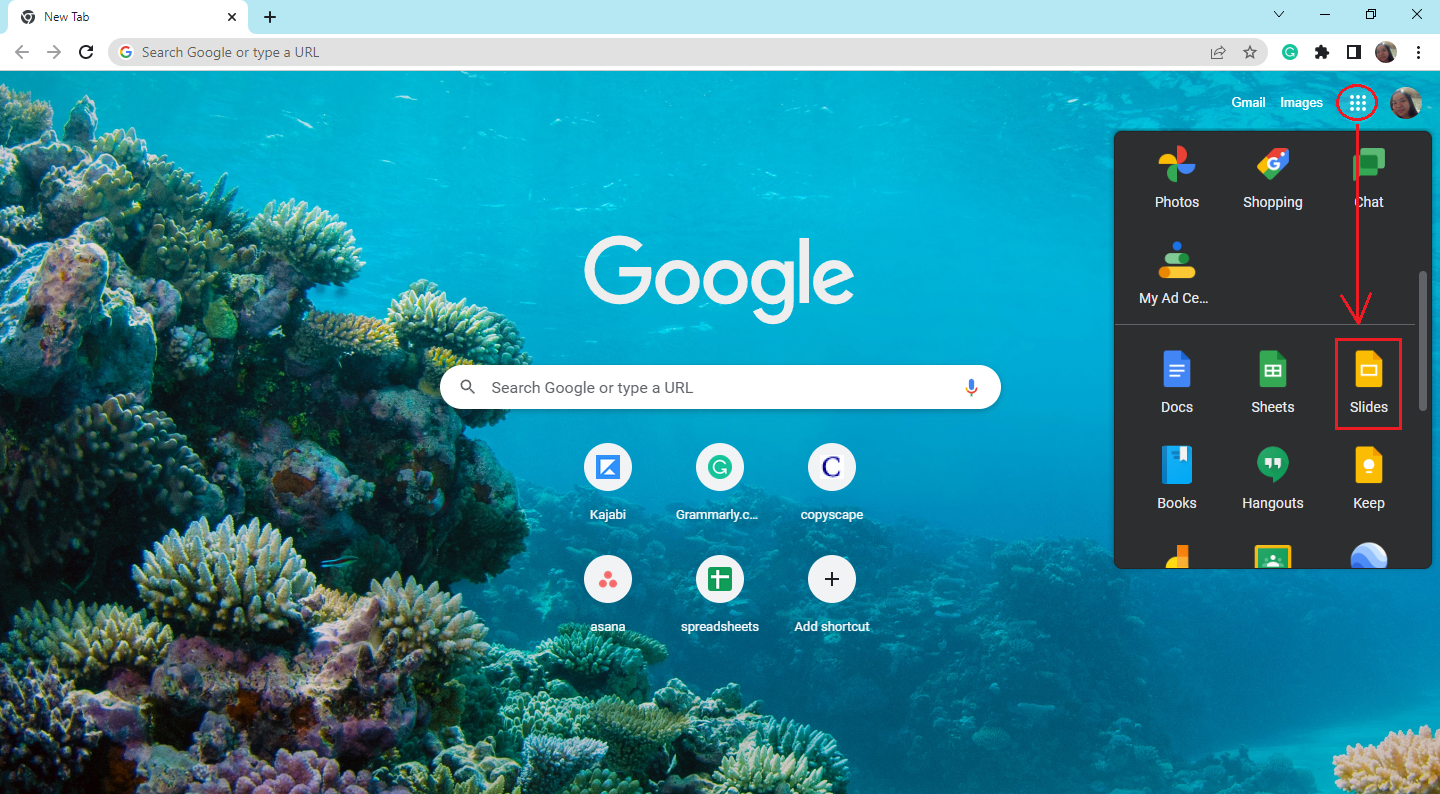
On Google Chrome, click the Apps button and select "Google Slides."
-
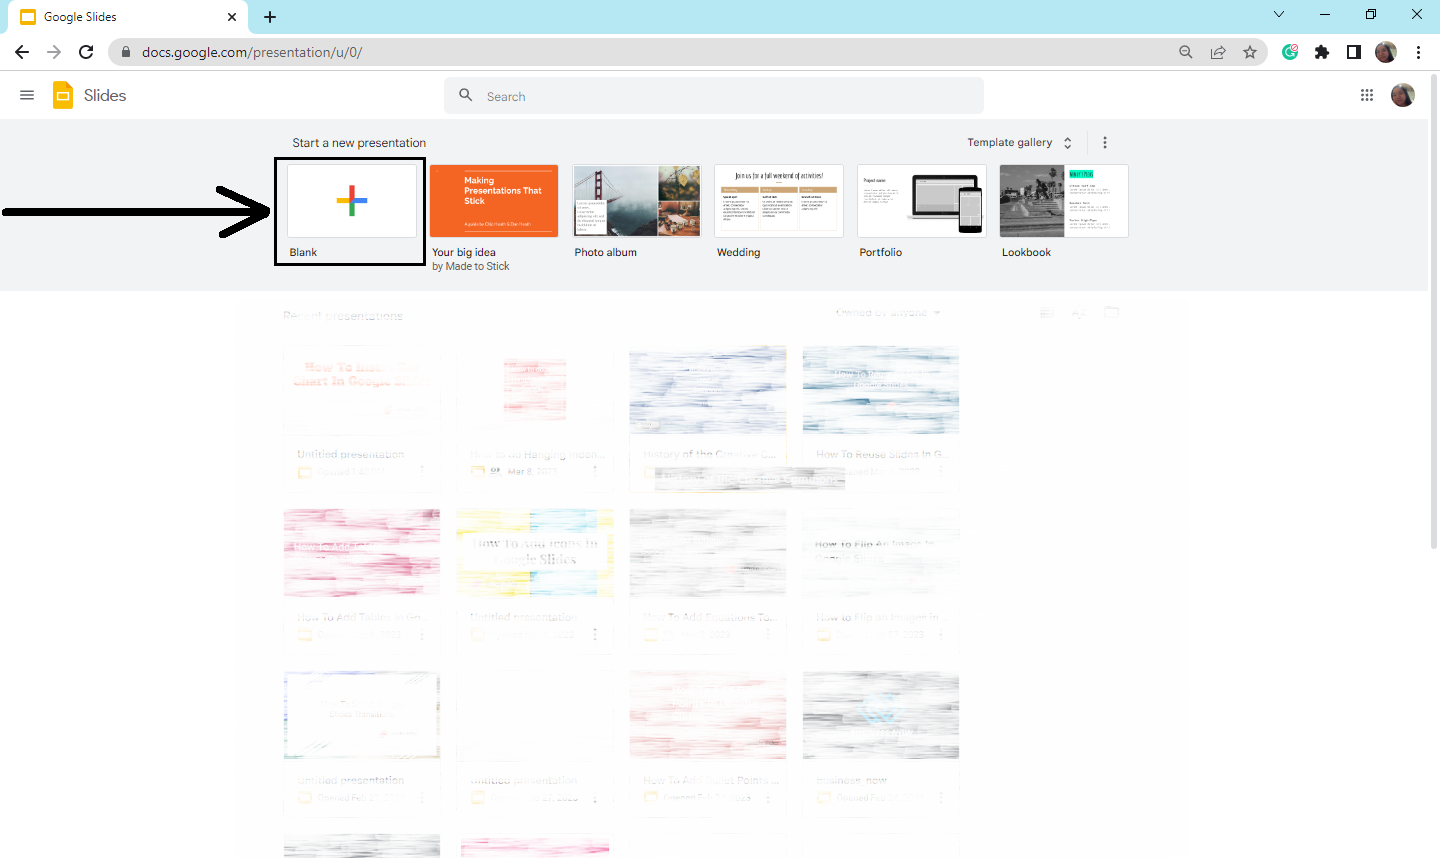
Select the blank presentation, then choose a slide where you want to insert a bar graph.
-
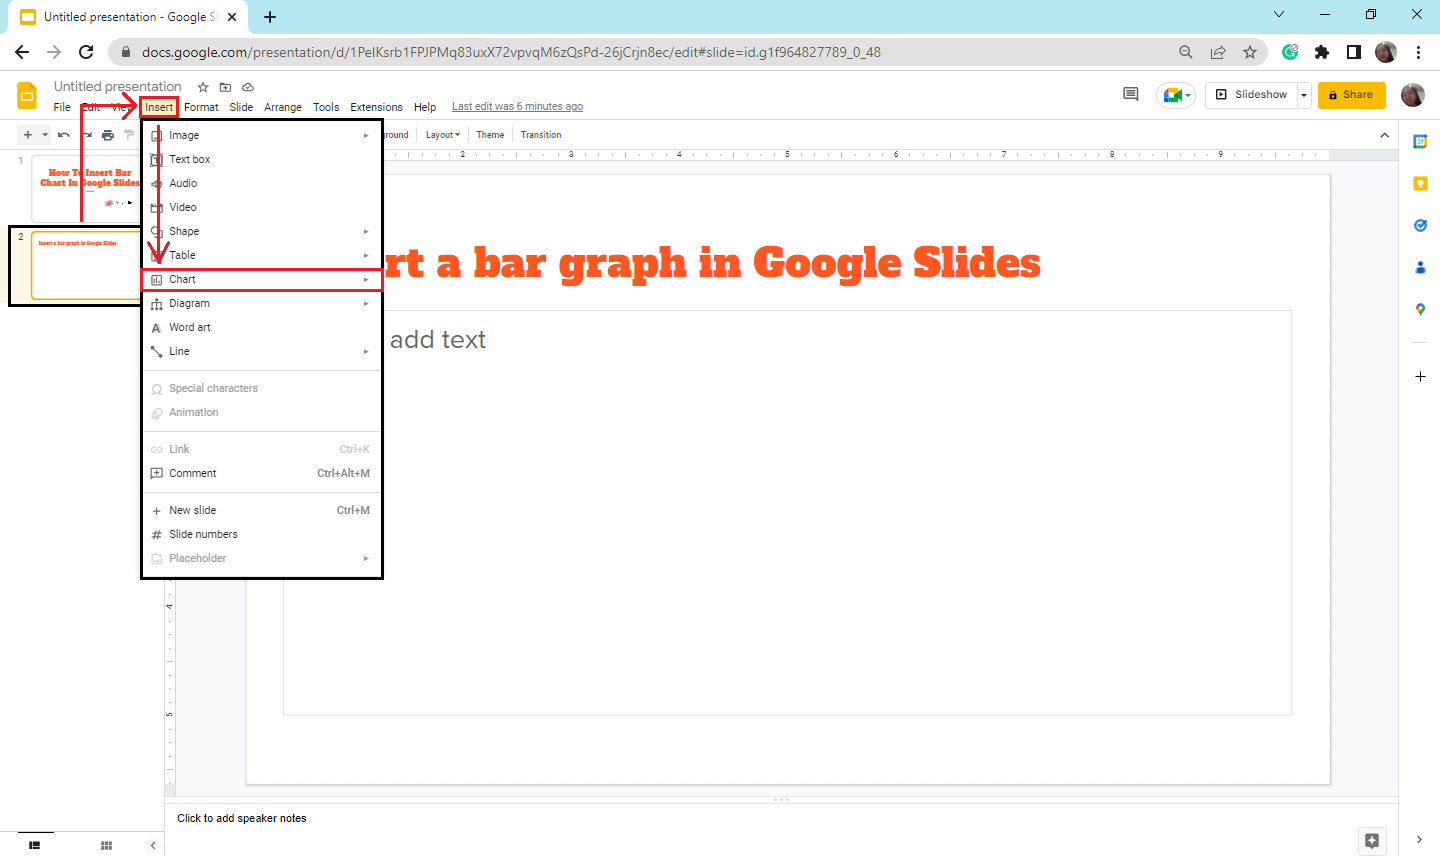
Click the "Insert" tab, then select the "Charts" option from the drop-down menu.
-
From the "Charts" context menu, select a specific chart type you want to use in your presentation. E.g., "Bar" graph type.
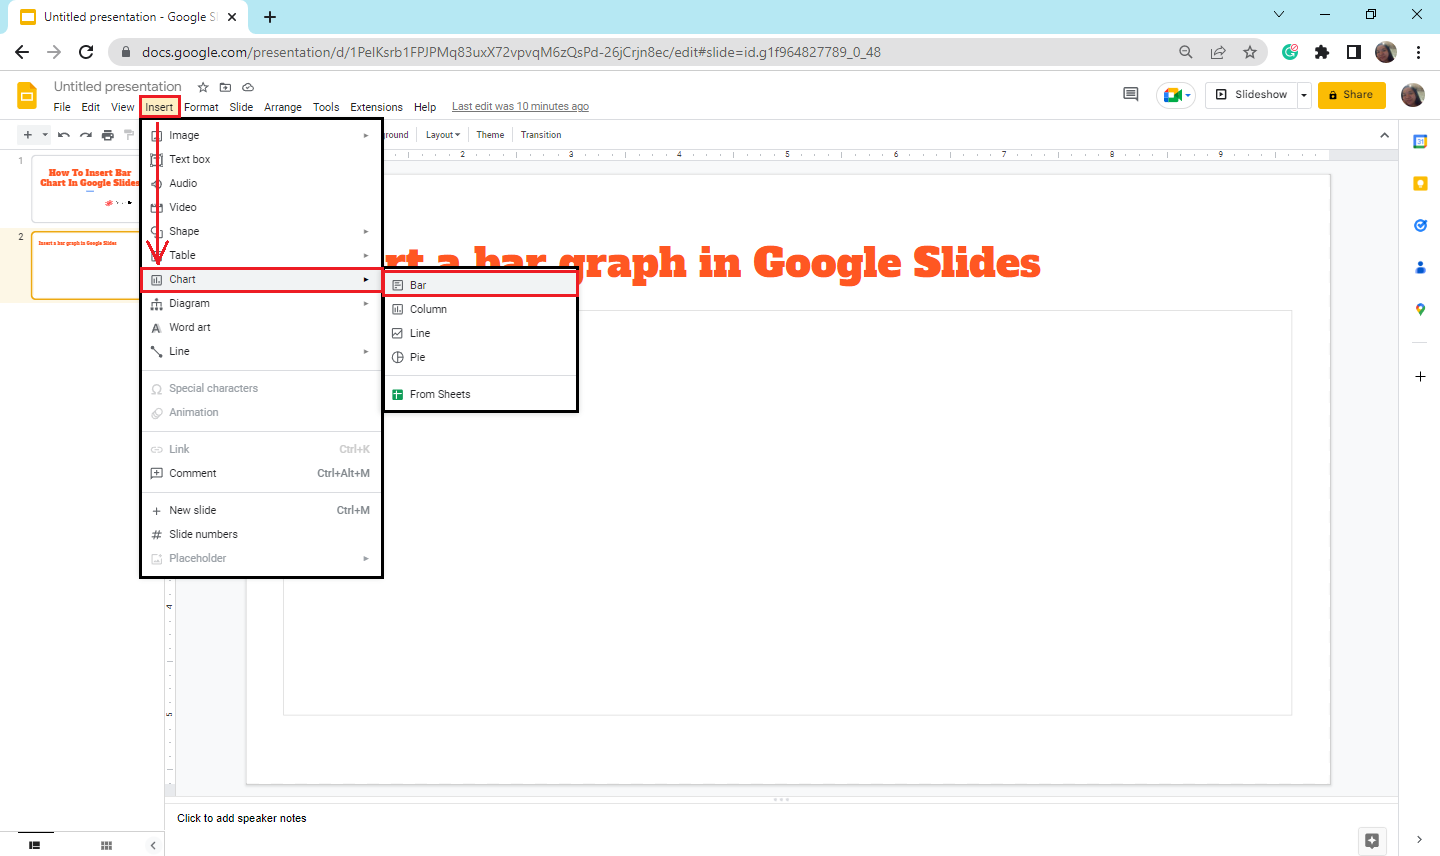
-
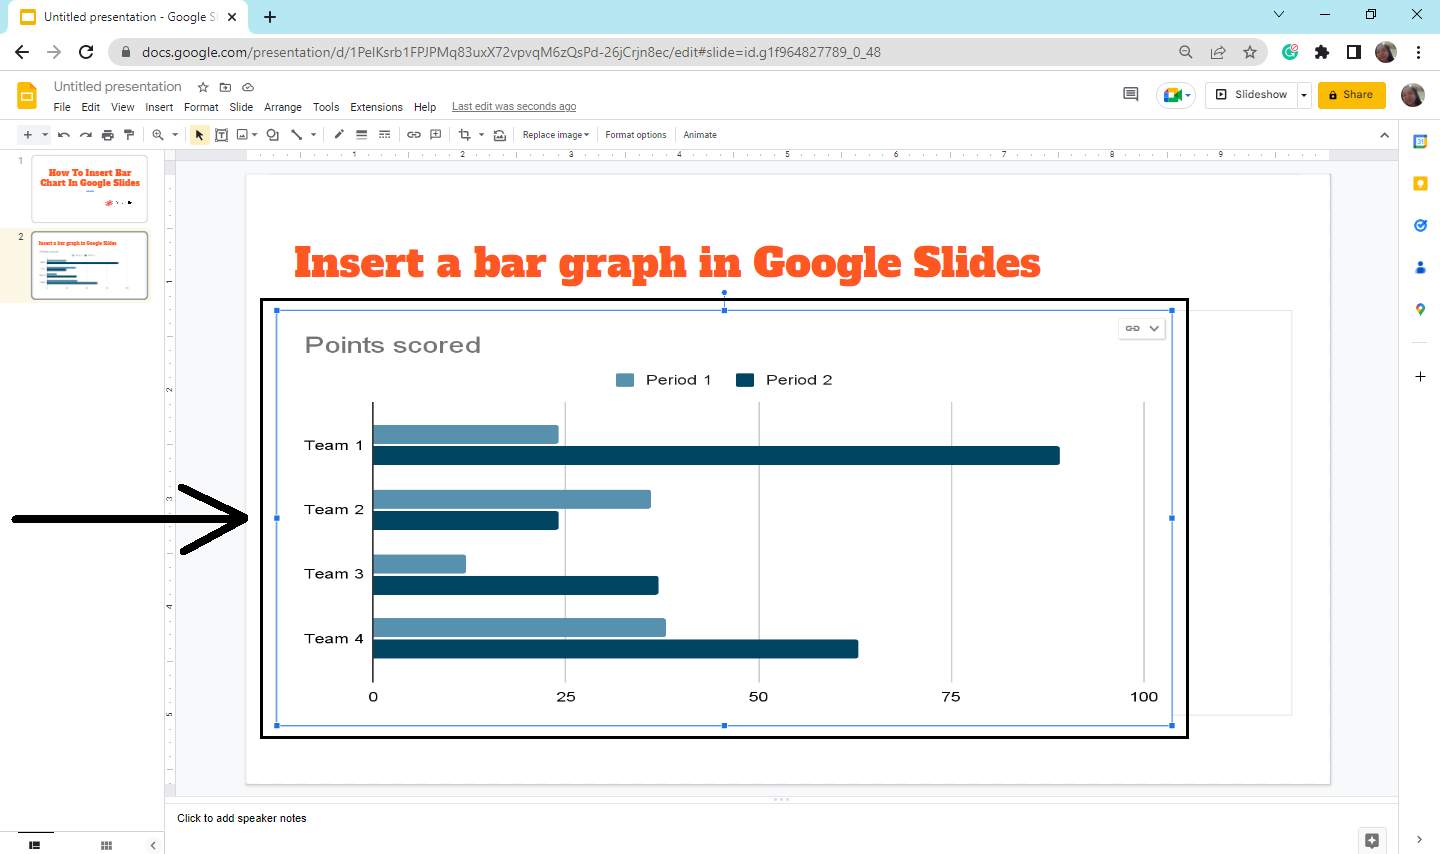
After selecting "Bar," your bar graph will appear on the slide. Resize and drag the graph accordingly.
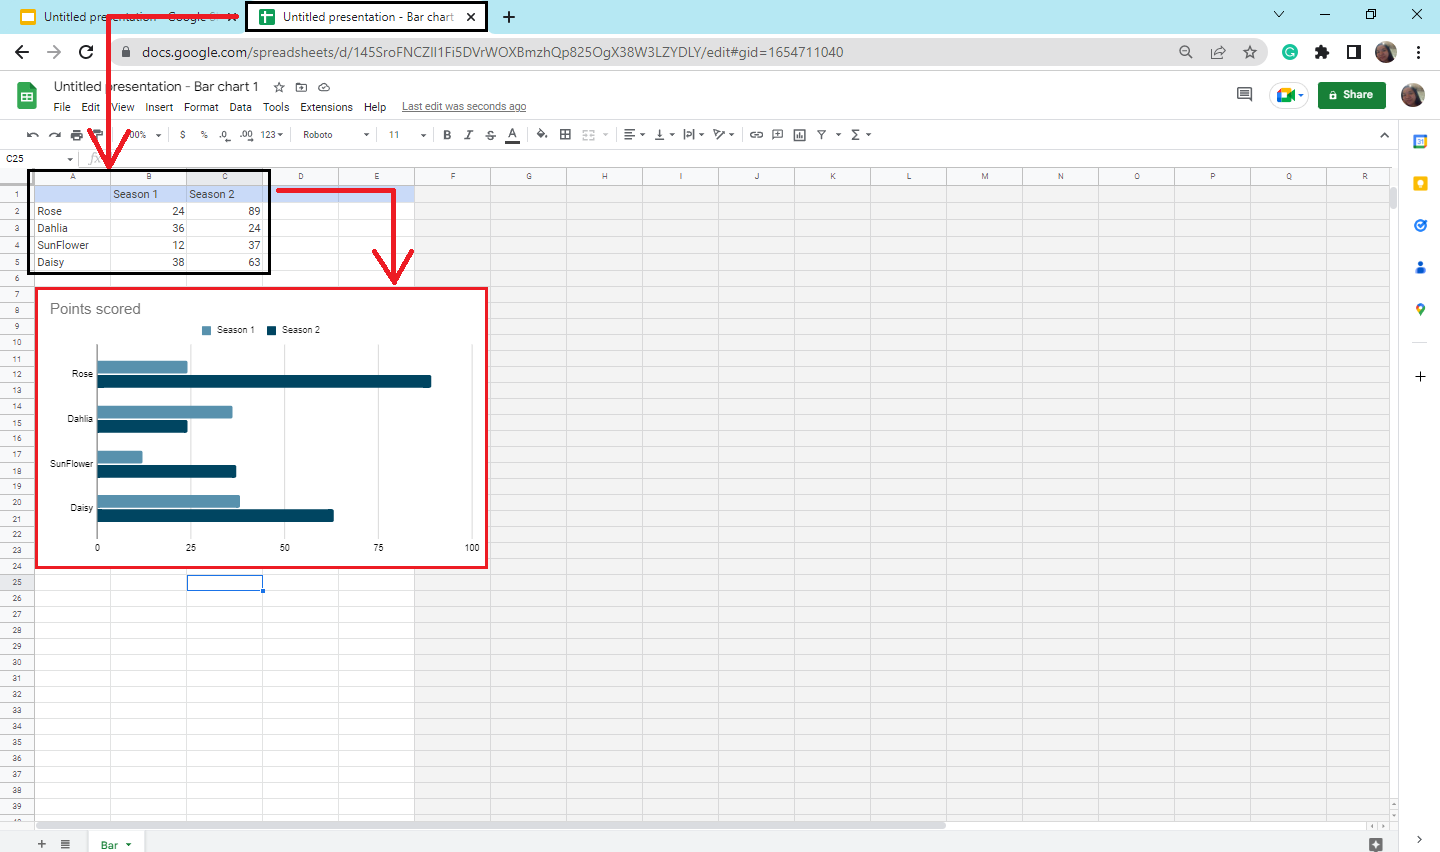
Input and edit the chart according to your data range.
To add and edit your data range to your chart in Google Slides, follow these steps:
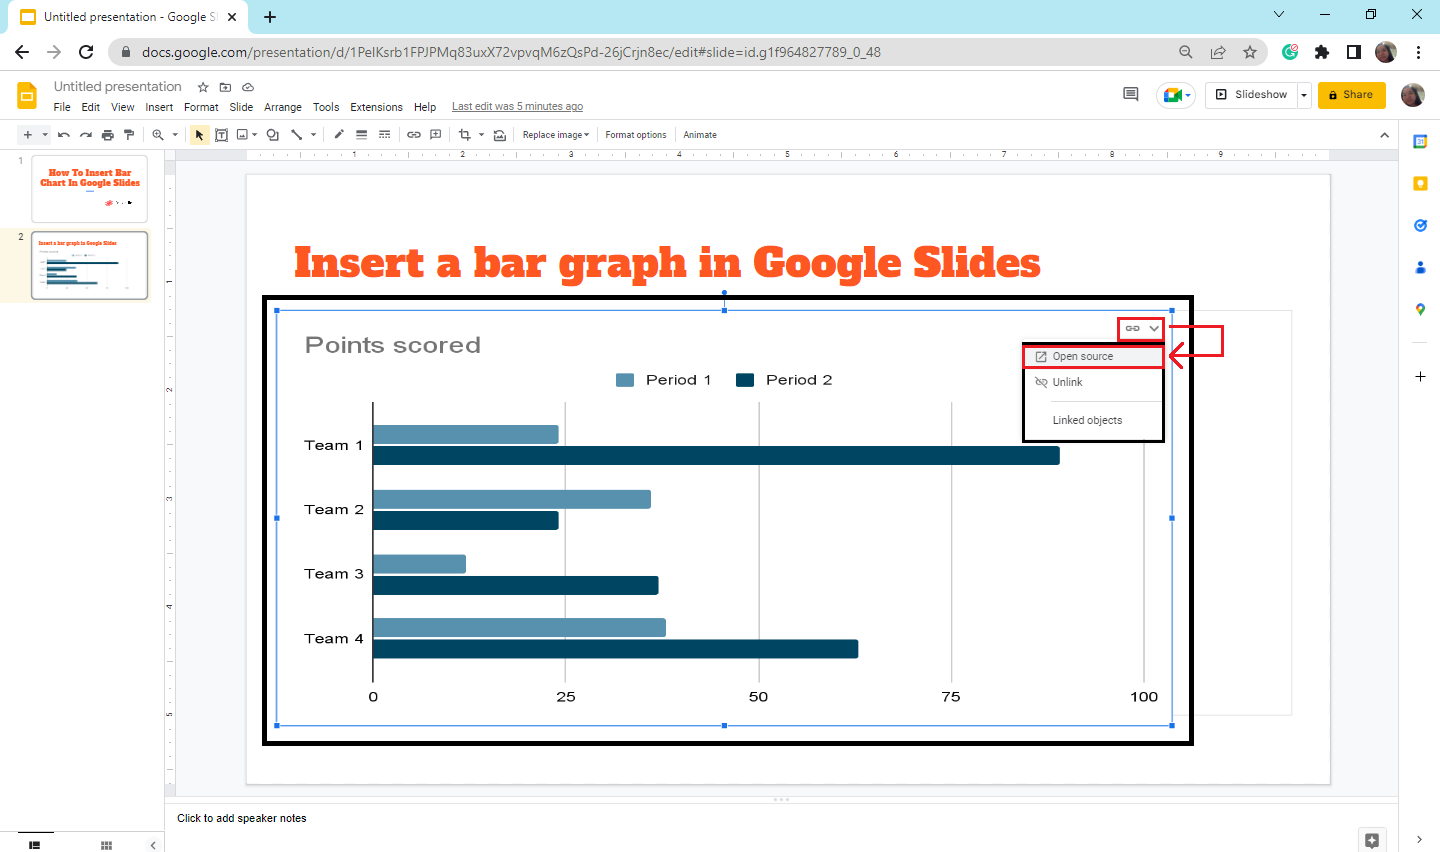
-
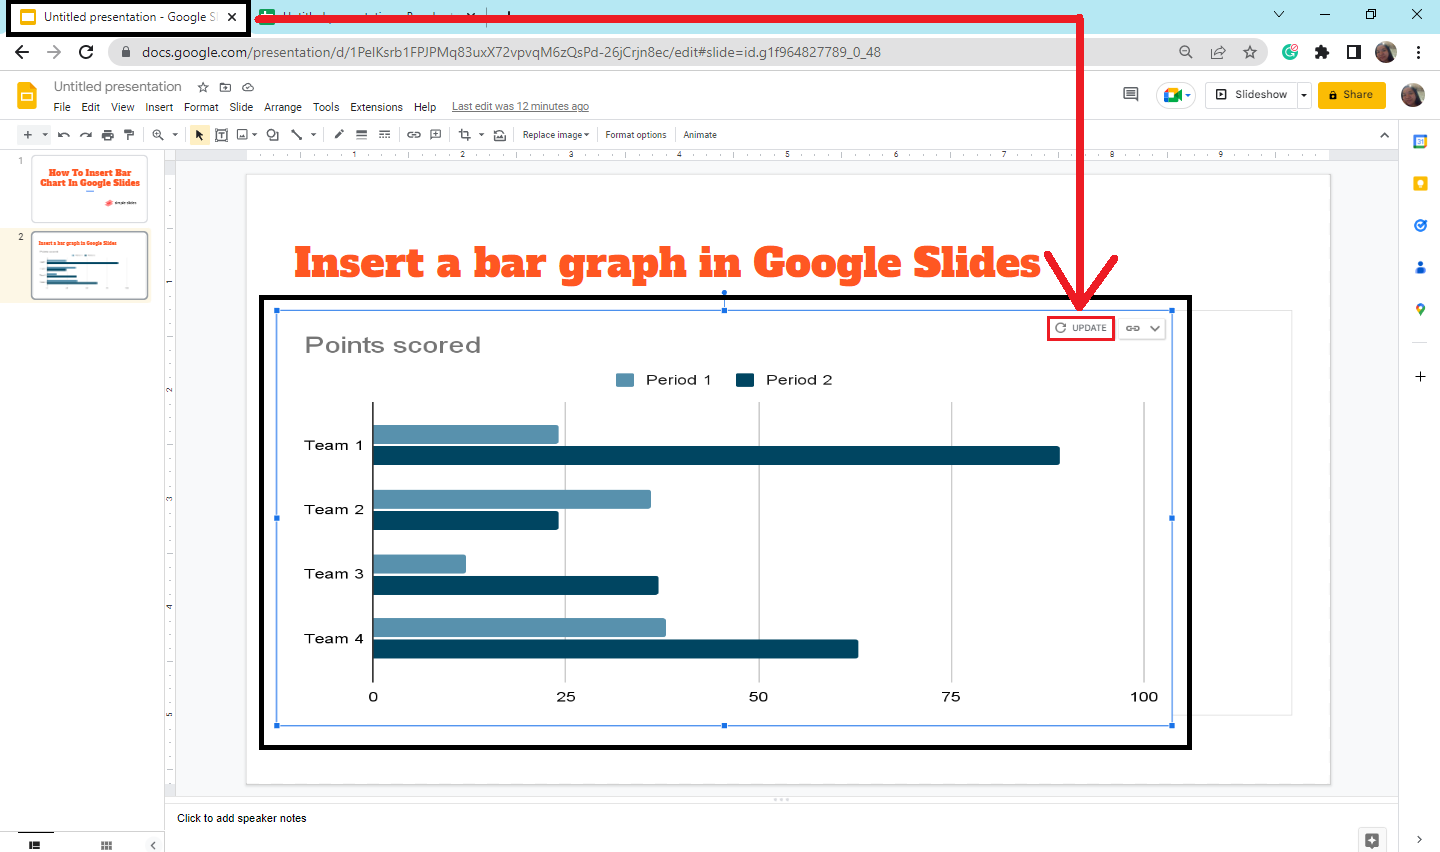
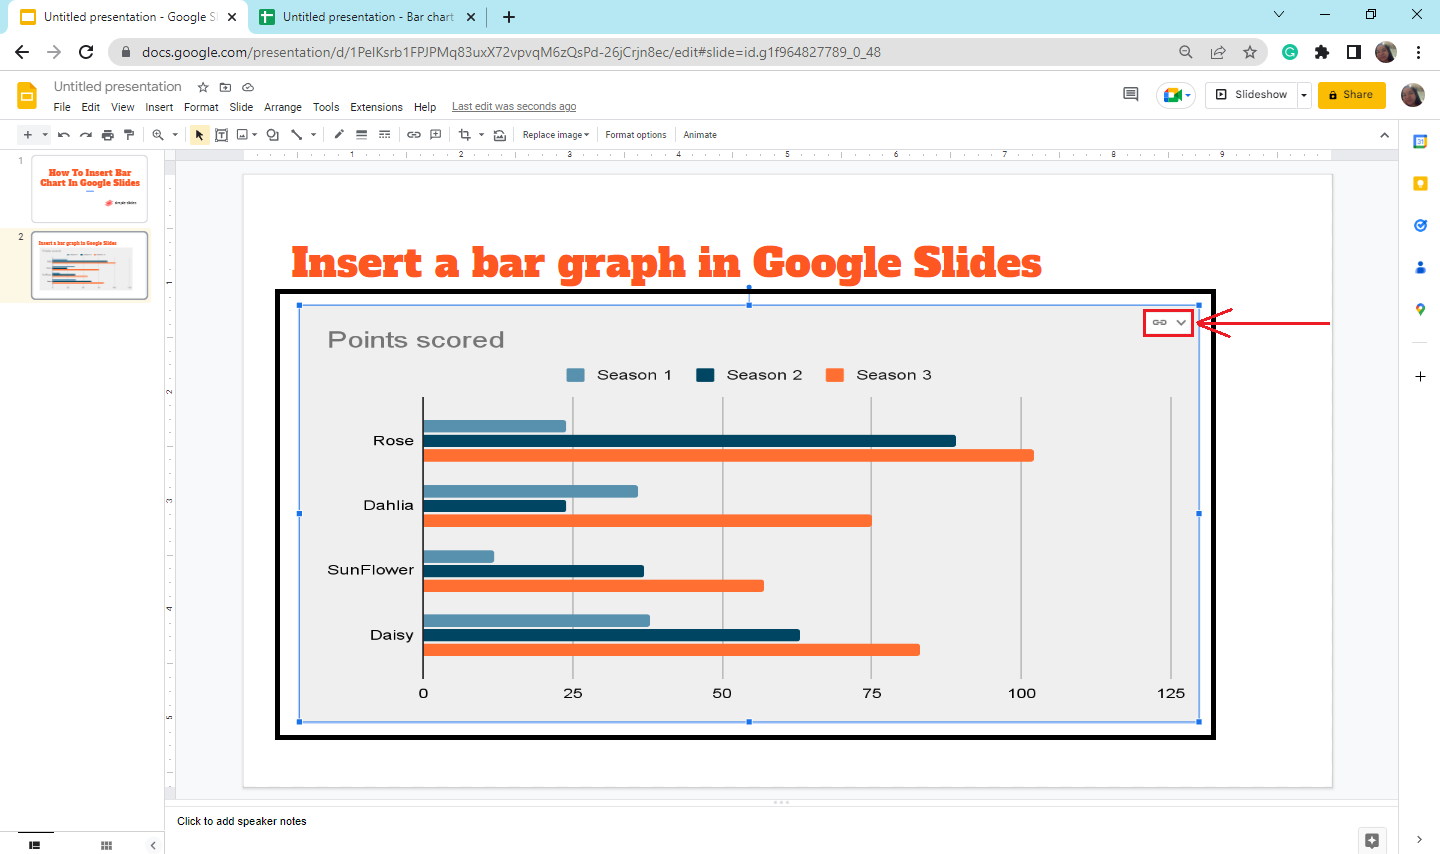
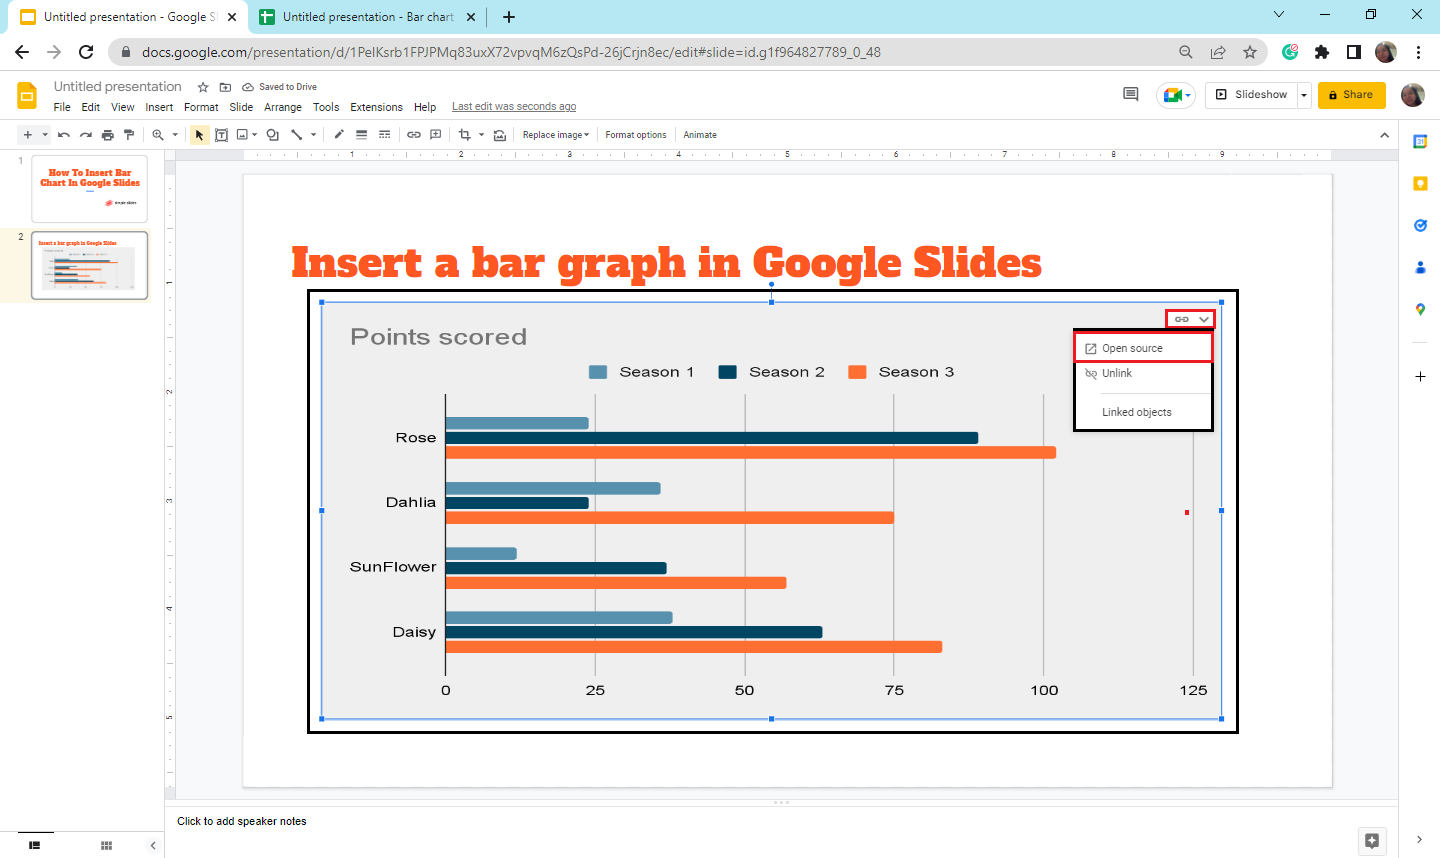
On your bar chart in Google Slides, click the arrow on the "Linked Chart" option in the upper-right corner.
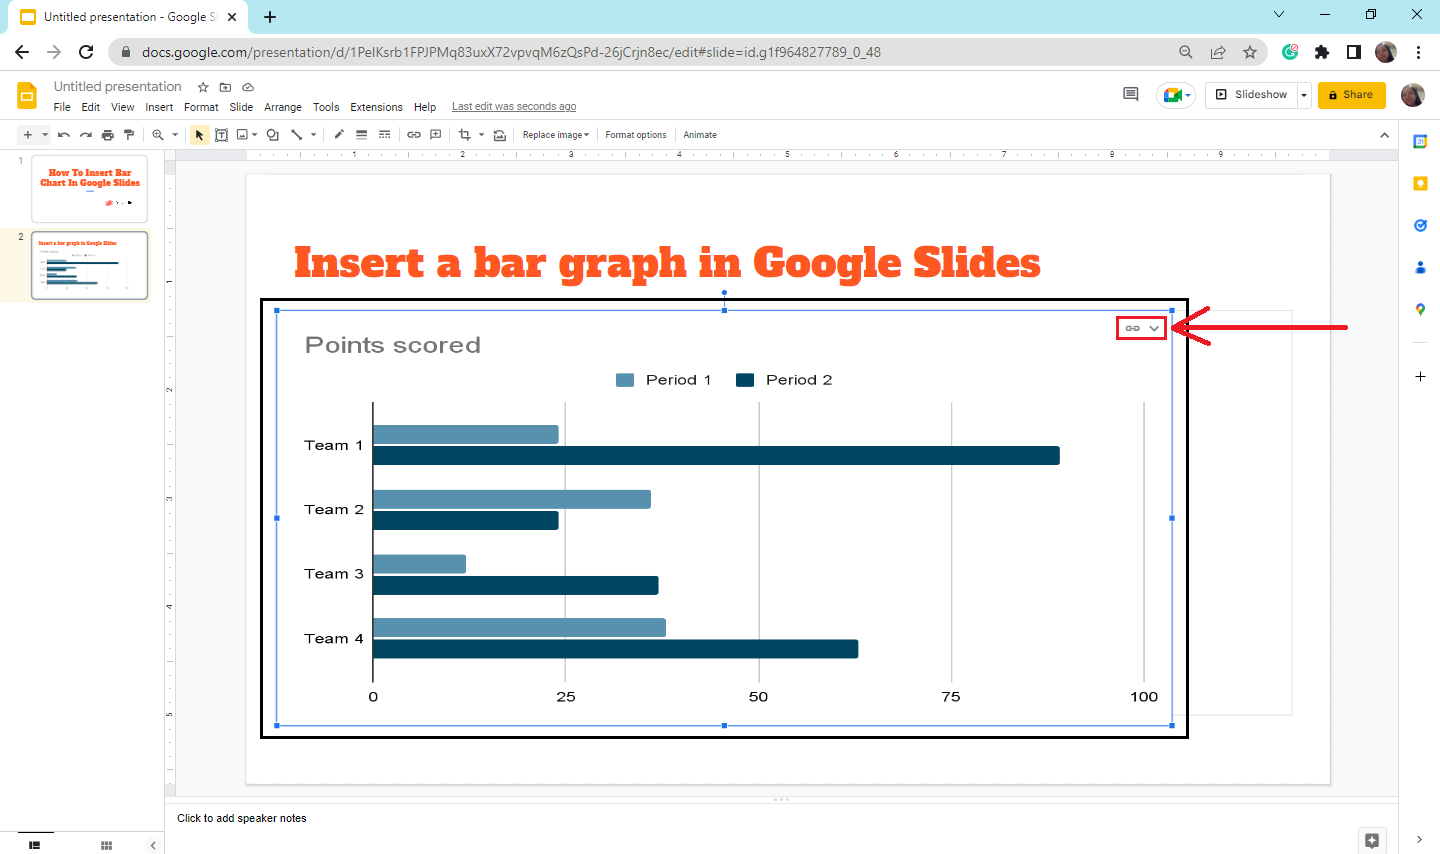
-
From the drop-down menu, select "Open Source." Doing so will redirect you to Google Sheets.
-
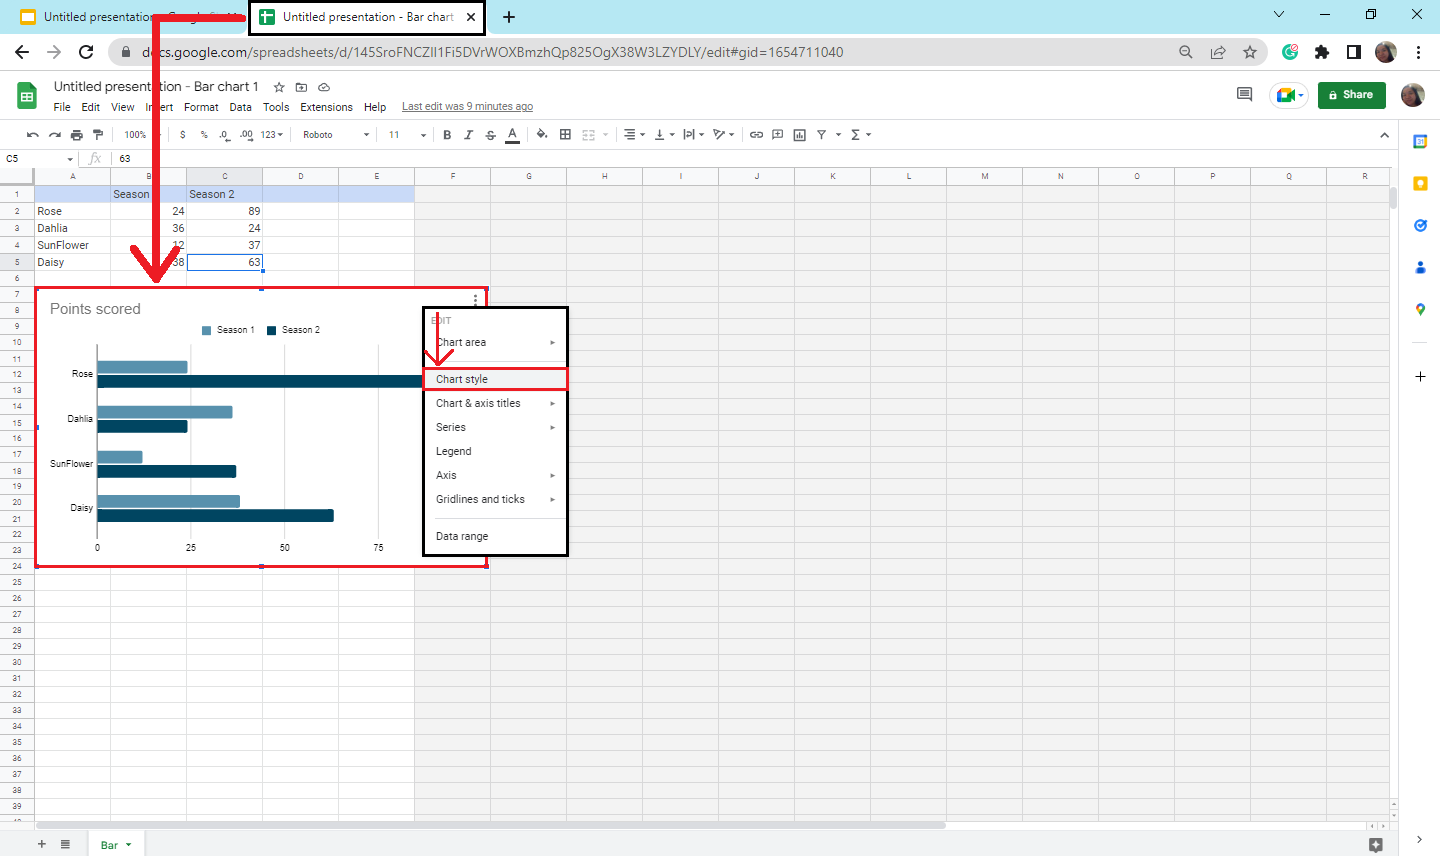
To edit the chart, start typing your data in the section provided in Sheets.
-
Select the "Google Slides" tab and click the "Update" button.
-
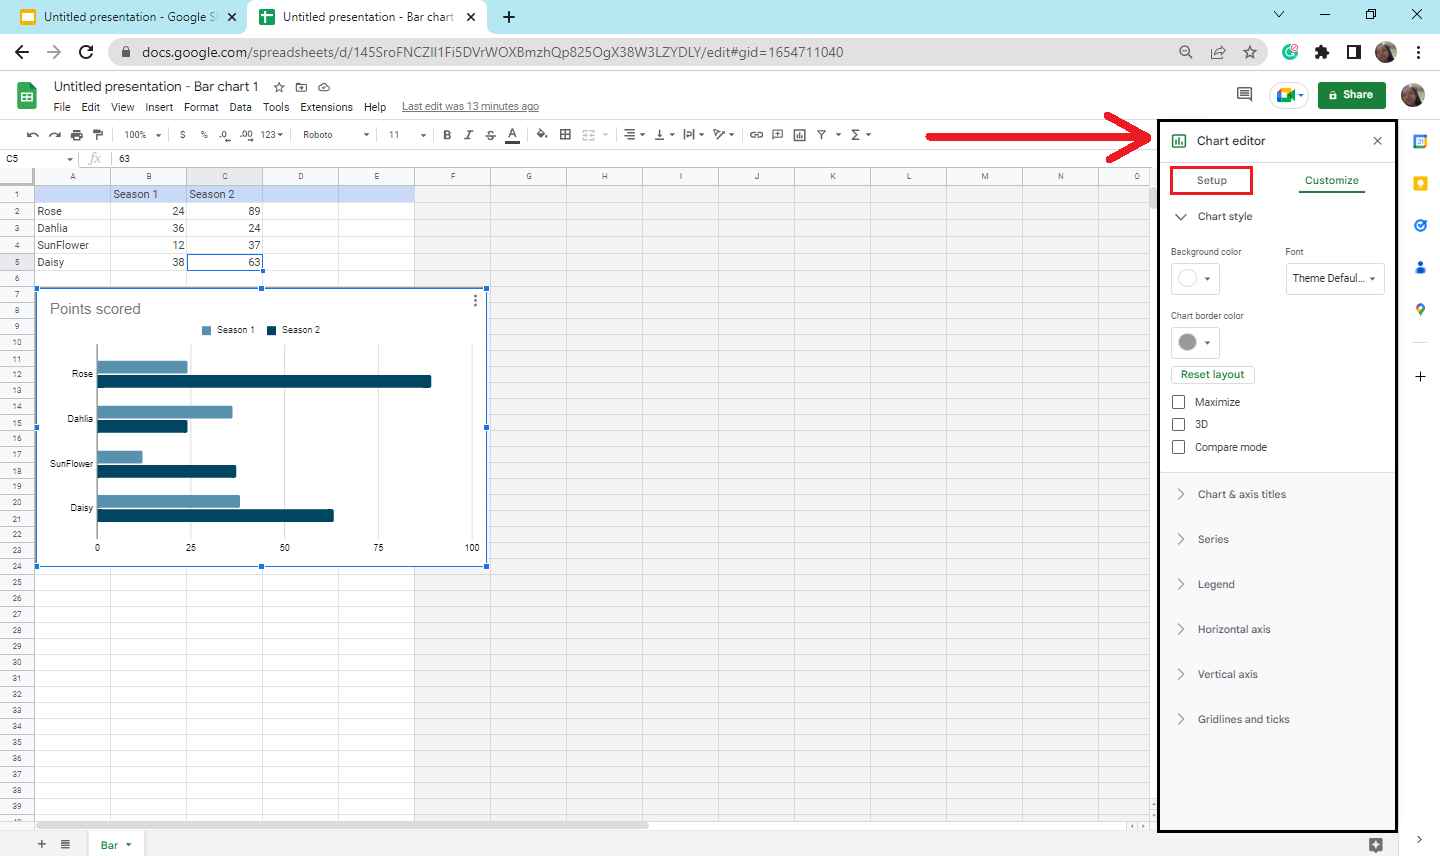
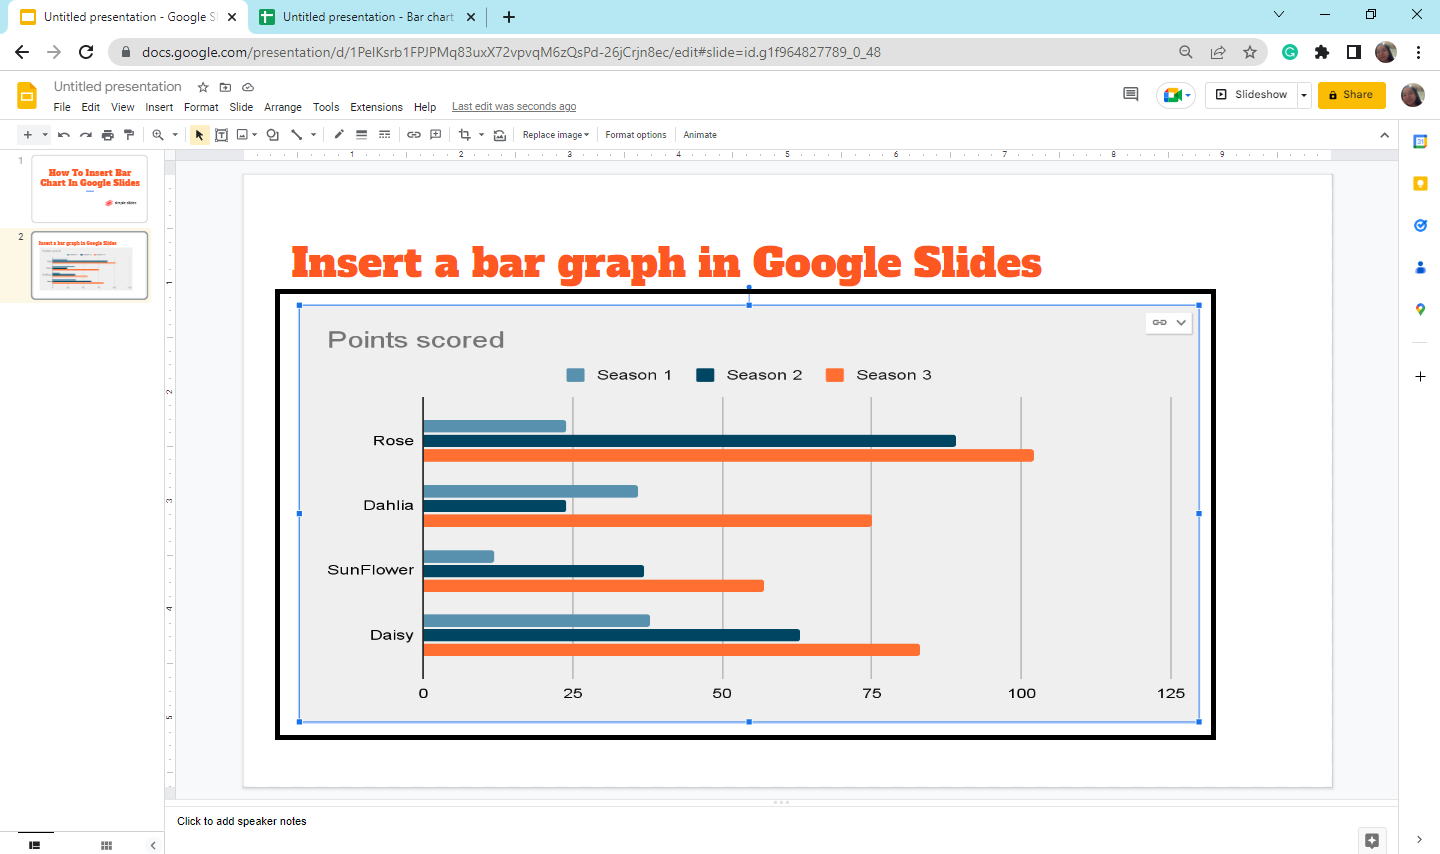
You can also insert additional series on your bar chart by returning to Google Sheets, right-clicking your chart in Google Sheets, and selecting "Chart style."

-
In the "Chart Editor" pane, select "Setup."
-
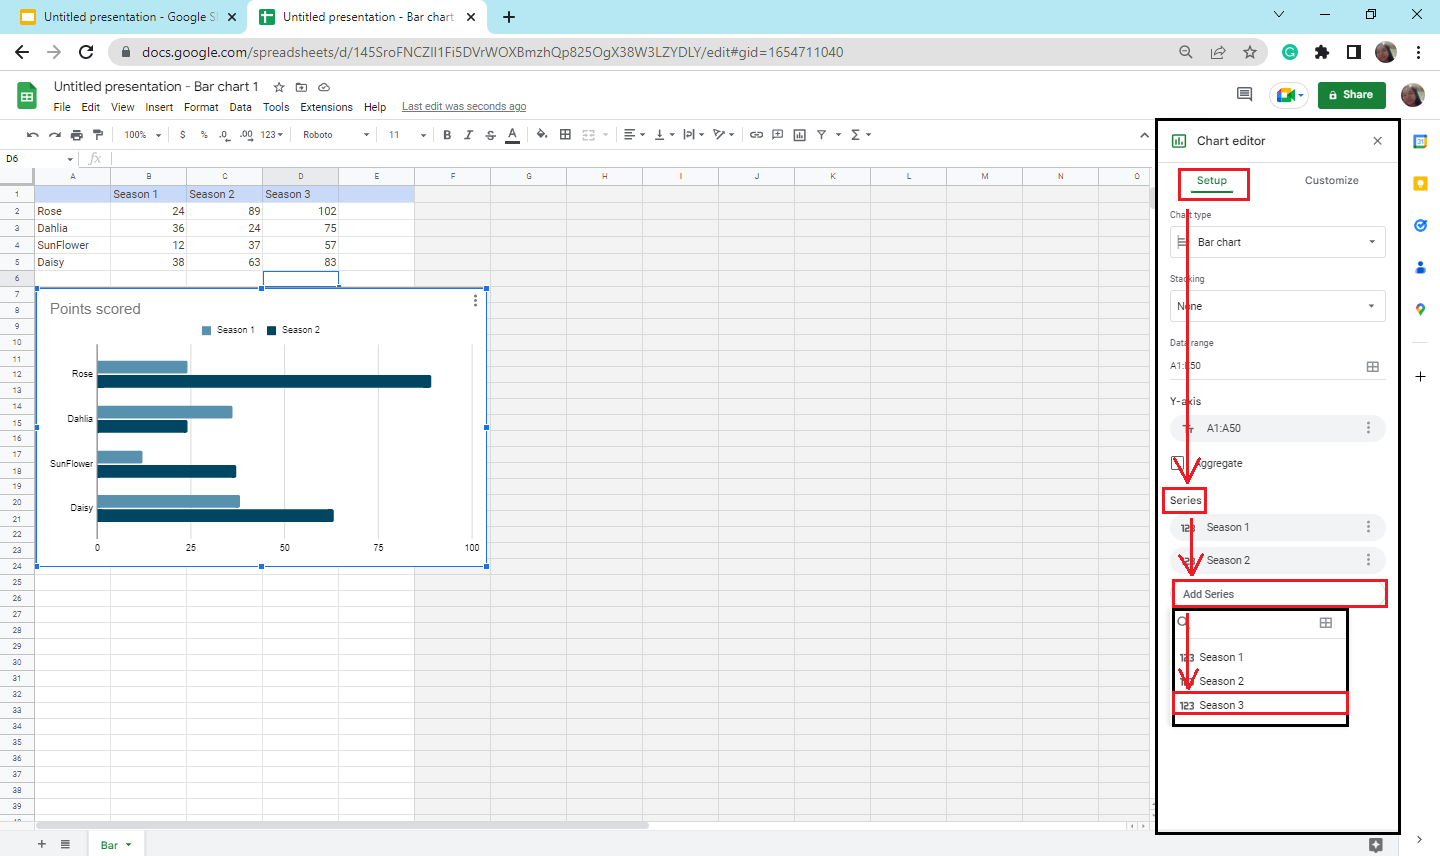
Go to "Series," then click the address bar and choose "123 Season 3" to add a new column to your bar chart data.
Customize your bar graph in Google Slides
To make changes to your Google Slides bar graph, follow these steps:
-
Click the "Linked Chart" option in your Google Slides bar chart.
-
In the drop-down menu, click "Open source" data to get redirected to the Google Sheets document.
-
Right-click the bar chart in the Google Sheets document and select "Chart Style."
-
A "Chart Editor" dialog box will appear on the right side of Google Sheets. Click the "Customize" option.
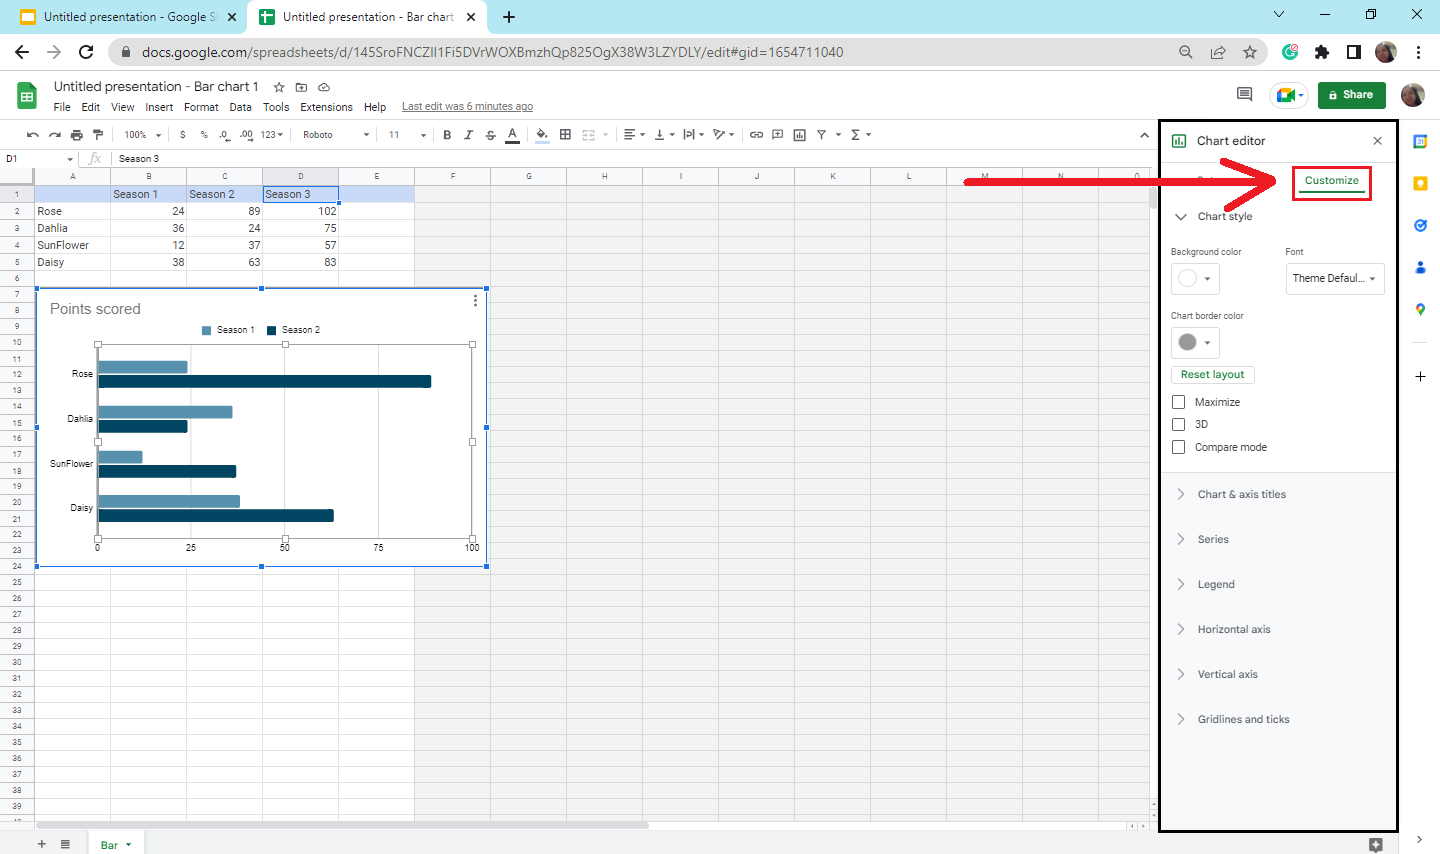
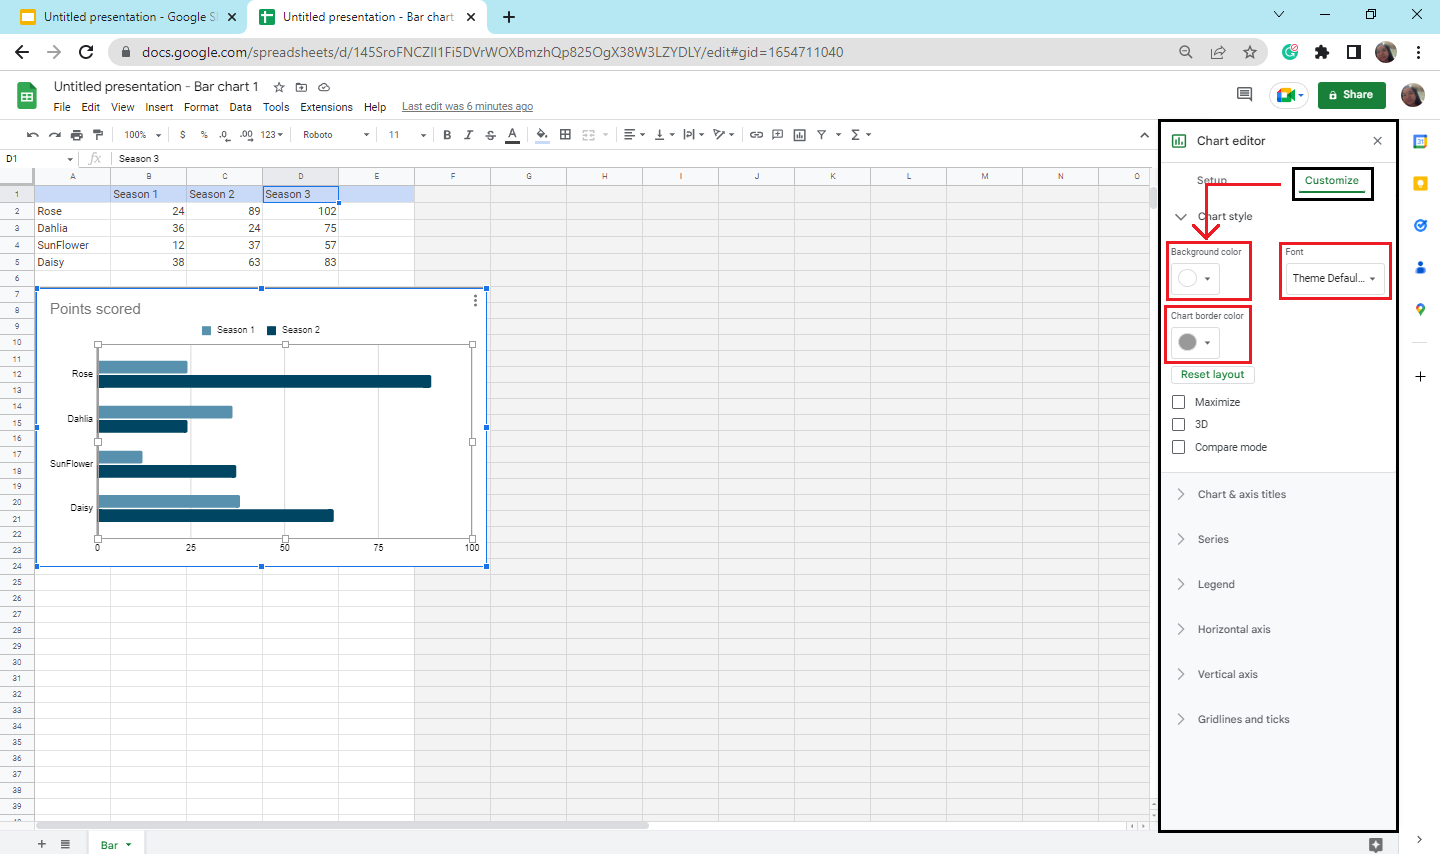
-
In the "Chart Style" section, you can choose to make changes to your "Background color," "Font," or "Chart border color."
-
After customizing your bar chart, return to Google Slides and click the "Update" button.
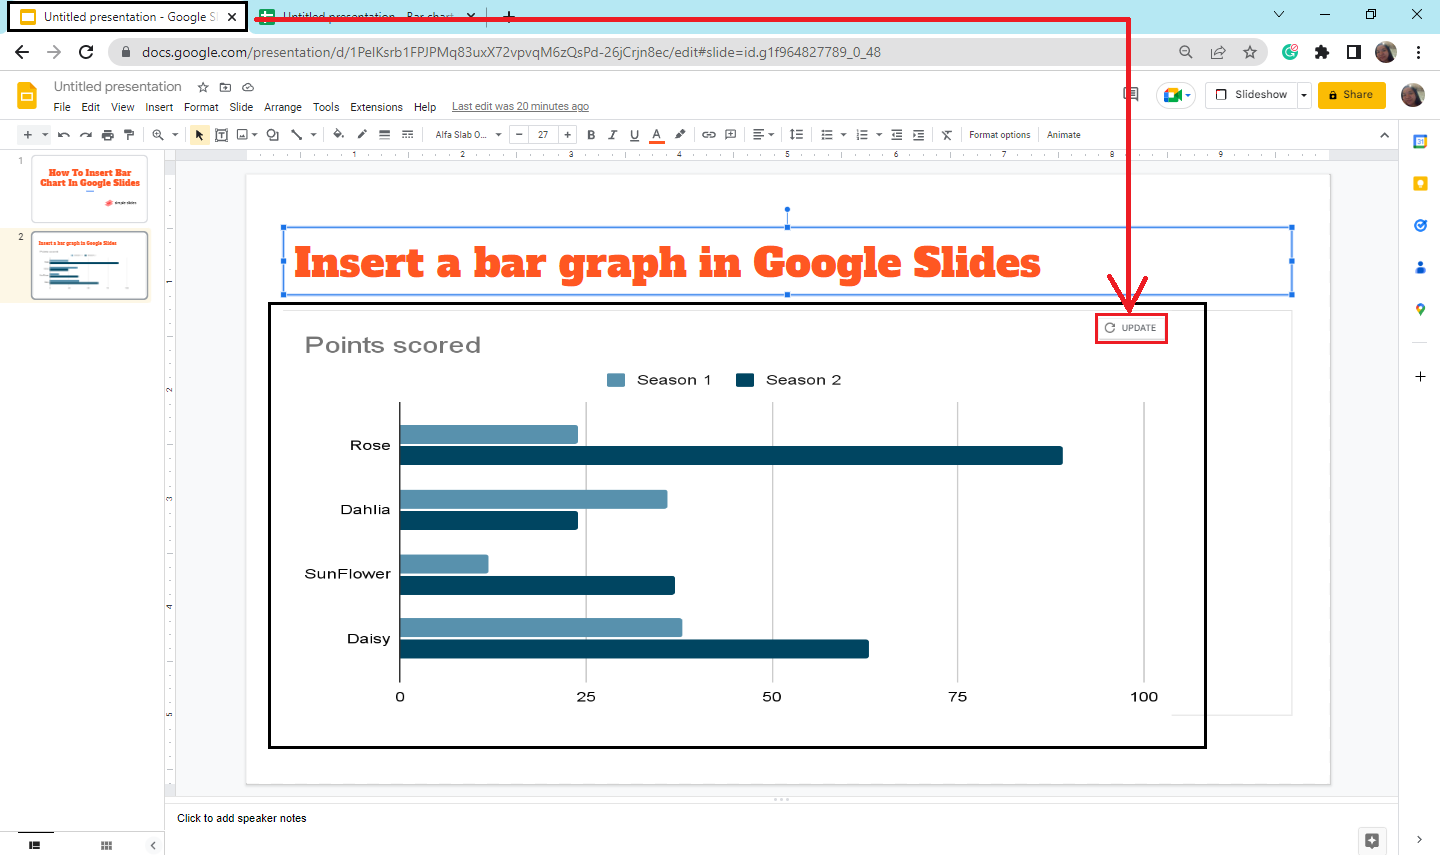
-
Once you click "Update," your updated chart will appear on Google Slides.
Final Thoughts on How to Insert a Bar Chart in Google Slides.
We hope our guide helped you insert charts and graphs in Google Slides effectively.
Read the FAQs below for more information about inserting charts in Google Slides! However, if you want more awesome and great Google Slides chart templates for your next presentation, subscribe to Simple Slides and get weekly updates on our featured templates!
Frequently Asked Questions on How to Insert Bar Charts in Google Slides:
How many charts are available in Google Slides?
There are four types of charts and graphs in Google Slides, namely:
-
Bar chart
-
Column chart
-
Line chart
-
Pie charts
If you want more chart types imported into your Google Slides, click "From Sheets."
How can I add a line chart in Google Slides?
To insert line charts in Google Slides, click the "Insert" tab, then choose "Charts" from the drop-down menu. Click the line chart in the section. Once you've done that, your "Line Chart" will immediately appear on that particular slide.
How can I insert a pie chart on Google Slides?
Click the "Insert" tab, select "Charts" from the drop-down menu, and then click the pie chart in the section to insert line charts into Google Slides. Your pie chart will immediately be seen on that specific slide.
Related Articles:
Learn How To Hide Slides in Google Slides
Get A Free Sample of Our Award-Winning PowerPoint Templates + University
Get A Free Sample of Our Award-Winning PowerPoint Templates + University
Join our mailing list to receive the latest news and updates from our team.
Don't worry, your information will not be shared.
We hate SPAM. We will never sell your information, for any reason.