How To Make Infographics
Aug 16, 2022
Infographics are one of the best means of communication today as they visualize information excellently.
You will find them everywhere: schools, social media, strategy meetings, product launches, etc. As a result, the ability to create stunning infographics has become a vital skill.
If you have PowerPoint on your computer, you already have a decent infographic maker. This blog post will tell you everything you need to know to create infographics.

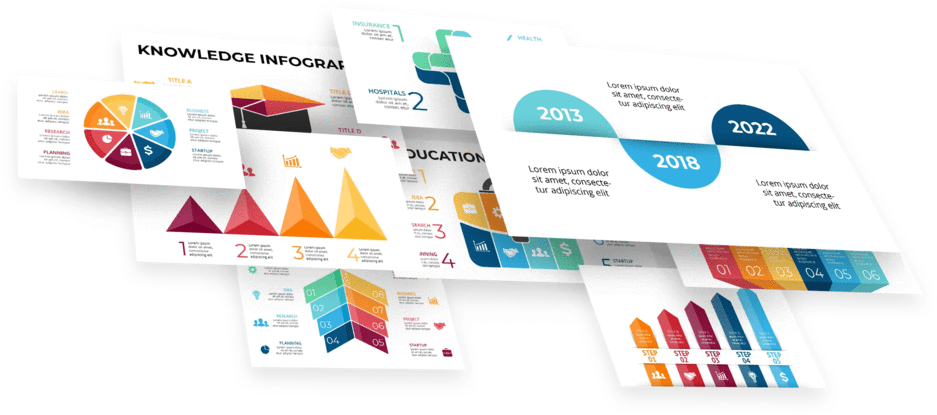
What Are Infographics?
An infographic refers to visual content for sharing information or data. It can consist of texts, images, charts, and other elements that aid the transfer of information.
Infographics are used across different industries to engage audiences and customers. These data visualizations are compelling because the human brain processes images incredibly fast. An example of this is the ease at which people communicate with memes on social media.
Additionally, people don't have the time or patience to concentrate on long boring content. By turning to infographics, you paint a visually pleasing picture instead of writing a thousand words.
We have the best marketing infographics for your business.
Creating Infographics With PowerPoint.

You can save money by learning how to create your infographic design. Here is how to make a great infographic with just a few clicks:
Open a Fresh Presentation.
Start creating infographics by launching a new presentation and opening a blank slide. Here is how to get it done:
- Launch PowerPoint
- Go to the "New" tab and select "Blank Presentation."
- Click on "Create."
Your screen will display a blank PowerPoint slide.
Switch to Portrait.
The slide you created should be in landscape mode. However, an infographic has to be in portrait mode. Hence, you must make a switch.
- Go to the "Design" tab
- Select "Slide Size" and then "Orientation."
- Switch to portrait
If you want to customize your infographic, you can edit its size. We recommend 6 x 14 inches.
Select a Background.
You can change your infographic's background if you want to give it more visual appeal or make it in sync with your idea.
- Right-click on the slide and select "Format Background."
- Select your preferred color, pattern, transparency, and more from the pane that appears.
Enter Your Title and Subheading.
Your title and subheading can make or break your infographic. Hence, you have to choose carefully.
Ensure your title and subheading texts are easy to read and attention-grabbing. They should also give the reader the information you are trying to pass on.
You will find two text boxes on the slide, one for your title and the other for your subheading. Click on them to enter your texts.
Use SmartArt.
Things are about to get more interesting. SmartArt is a PowerPoint tool to add visual elements to your infographic slide. Do you want to insert a graph, picture, or shape into your slide? Use SmartArt.
- Go to the "Insert" tab and select "SmartArt."
- It would be best if you were looking at different types of graphics. Once you find your preferred option, select it and click on "OK."
- You can continue to customize the graphic by clicking on it and selecting either "Design" or "Format."
Enter Your Texts.
Remember that the reason why you are creating this infographic slide is to pass information. It is time to elaborate on your title and subheading.
Brevity is essential. Avoid unnecessary information and make your text as straightforward as possible.
You can add texts to your infographic's background and SmartArt graphics.
- For background texts, select "Insert" and click on "Text Box." Decide where to place the texts.
- For texts on SmartArt graphics, select the graphic and start typing in the text box.
Get these strategy infographics for free!
Insert Pictures.
Add images to your infographic to give your audience the best experience. Think of an image that can convey the message you are trying to pass and beautify your slide.
You can insert a downloaded picture or search directly from PowerPoint. Follow these steps to insert a downloaded image:
- Go to the "Insert" tab and click on "Picture."
- It will take you to your file manager. Select and upload your image
Save It.
After creating your visually appealing infographic, the final step will be to save it. You risk losing your infographic if you don't save it well.
- Go to the "File" tab.
- Select "Save As." You will now have to name the file and select a file type
- Click on "Save"
Check out our timeline infographic templates.
Infographics Best Practices.

Data visualization goes beyond designing beautiful infographics. It would be best to have more to ensure your target audience gets your message.
Simplicity.
Less is more when it comes to infographics. Be concise when adding information to your slide.
You should also keep the design as simple as possible.
Grab Attention.
You should do your best to make your infographic attention-grabbing. Your headline should capture the readers' interest and interest them in your content.
Research.
If you are struggling to get ideas, don't worry. It happens to even the best designers. An excellent way to get ideas is to check the infographics your competitors are putting up and try improving them.
You can also get inspiration from platforms such as Pinterest and Visually.
Be Focused.
Resist the urge to fill your infographic presentation with excessive data. Focus on one data point or provide enough data points to give your audience an overview of the topic.
Final Thoughts.
Infographics will help you communicate with your target audience better. We have explained the easiest to create an infographic slide yourself. But if you think creating infographics is time-consuming, you can always download your professional infographic template from Simple Slides.
Frequently Asked Questions:
What is the best app to make infographics?
You can make excellent infographics with PowerPoint.
What is the easiest way to make an infographic?
The easiest way to make infographics is to use an infographic template from Simple Slides.
What to use in creating infographics?
You will need a computer and an infographic maker to create infographics.
Related Articles:
Get A Free Sample of Our Award-Winning PowerPoint Templates + University
Get A Free Sample of Our Award-Winning PowerPoint Templates + University
Join our mailing list to receive the latest news and updates from our team.
Don't worry, your information will not be shared.
We hate SPAM. We will never sell your information, for any reason.