
How To Create a Venn Diagram
Aug 01, 2022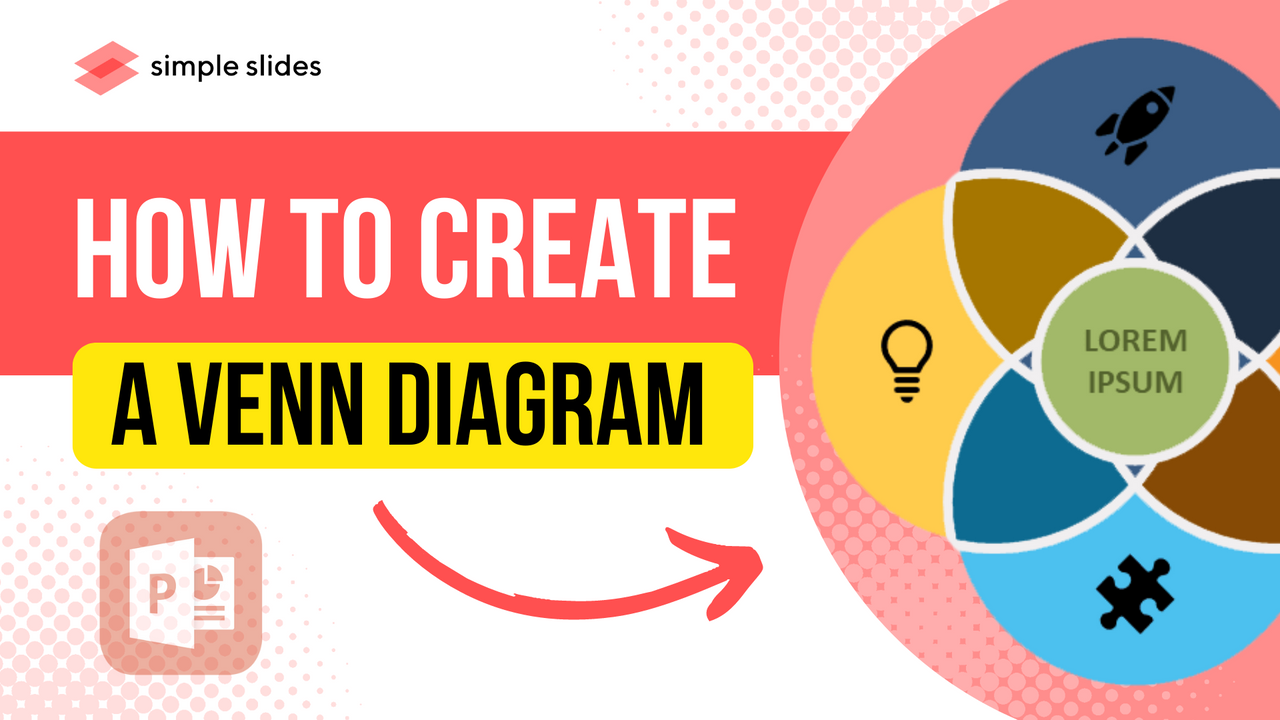
If you are thinking about creating a Venn diagram for your presentation, you are in the right place.
You can create a Venn diagram with the aid of PowerPoint's SmartArt. The process is simple and fast, so you should be done in seconds.
Though PowerPoint provides simple Venn diagrams, we will show you how to design visually appealing and engaging Venn diagrams using SmartArt.

Creating a Venn Diagram in PowerPoint.
Here is a step-by-step on how to design a stunning PowerPoint Venn diagram:
1. Open an Empty Slide.
Launch PowerPoint, select "New," and click "Blank Presentation."
![]()
2. Insert SmartArt Graphic.
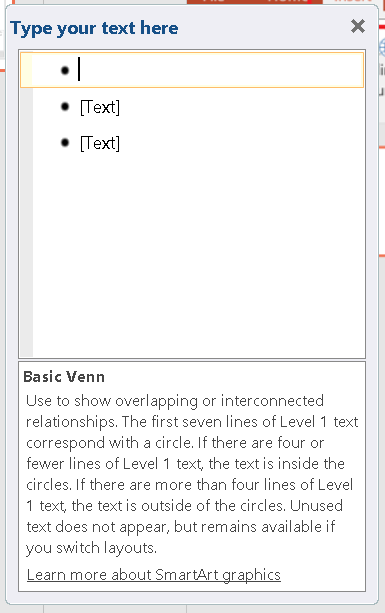
You will find SmartArt in the "Insert" tab; click on it. Your screen will display a "Choose a SmartArt Graphic" window; click "Relationship" on the left pane.
Select "Basic Venn" to preview the graphic, and click "OK" to confirm. This command will get a basic Venn diagram inserted.

3. Inserting and Removing Overlapping Circles.
Your basic Venn diagram will consist of three circles. However, depending on your needs, you can adjust the number of circles in your Venn diagram.
To insert a new circle, press the "Enter" button in the text pane to add a bullet point. Also, you can remove a circle by deleting a bullet point.
4. Adjusting the Size.
You can increase or decrease the size of your Venn diagram. Do this by dragging the edges of the SmartArt box.
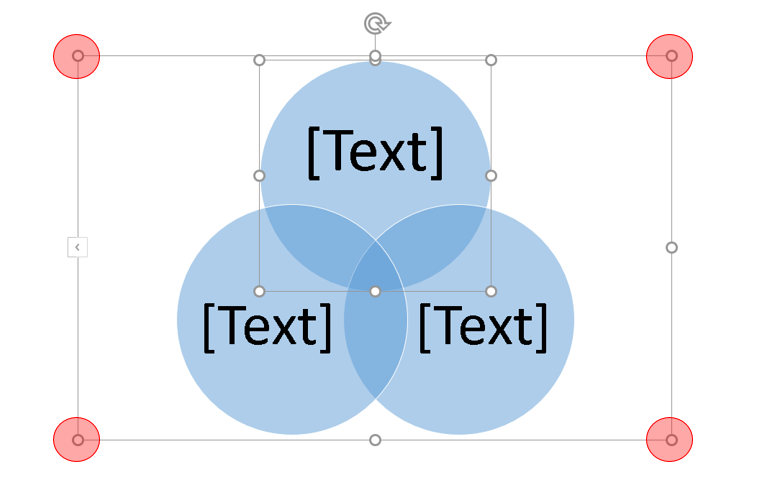
You can also resize each circle. To do this, click on a circle and drag the edges of its box.

Don't miss out on our Harvey Balls template.
5. Adding Texts.
You can easily add texts to your Venn diagram to show what each circle represents. All you have to do is to select a circle and type in its text box.

You can also enter your texts by editing the bullet points on the left side of the SmartArt box.

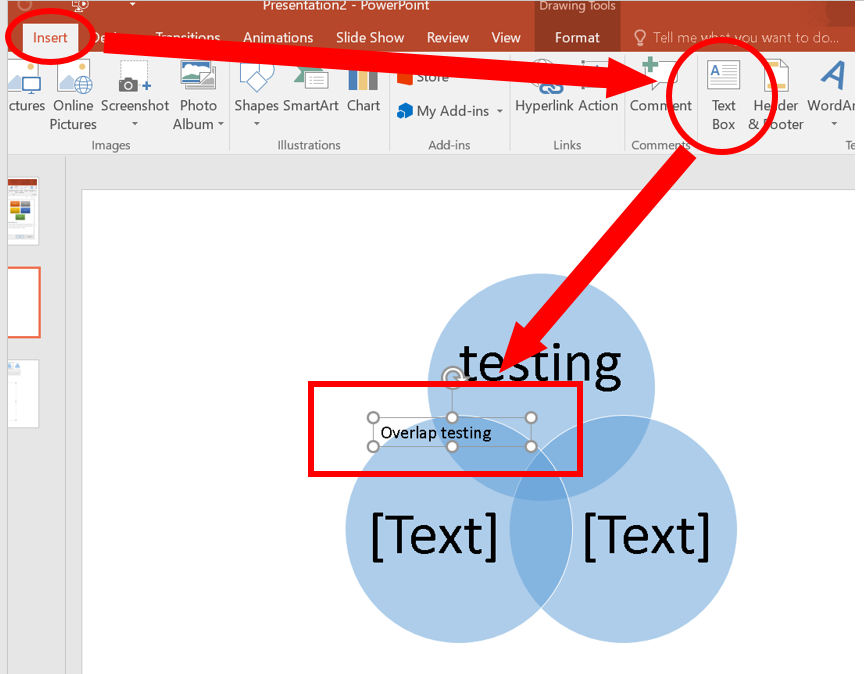
However, adding text to areas where your circles overlap will be more complicated as you must insert new text boxes. Go to the "Text" category in the "Insert" tab and click on "Text Box."
You should now have a down arrow instead of a cursor. Drag your text box to the overlap and enter your texts.
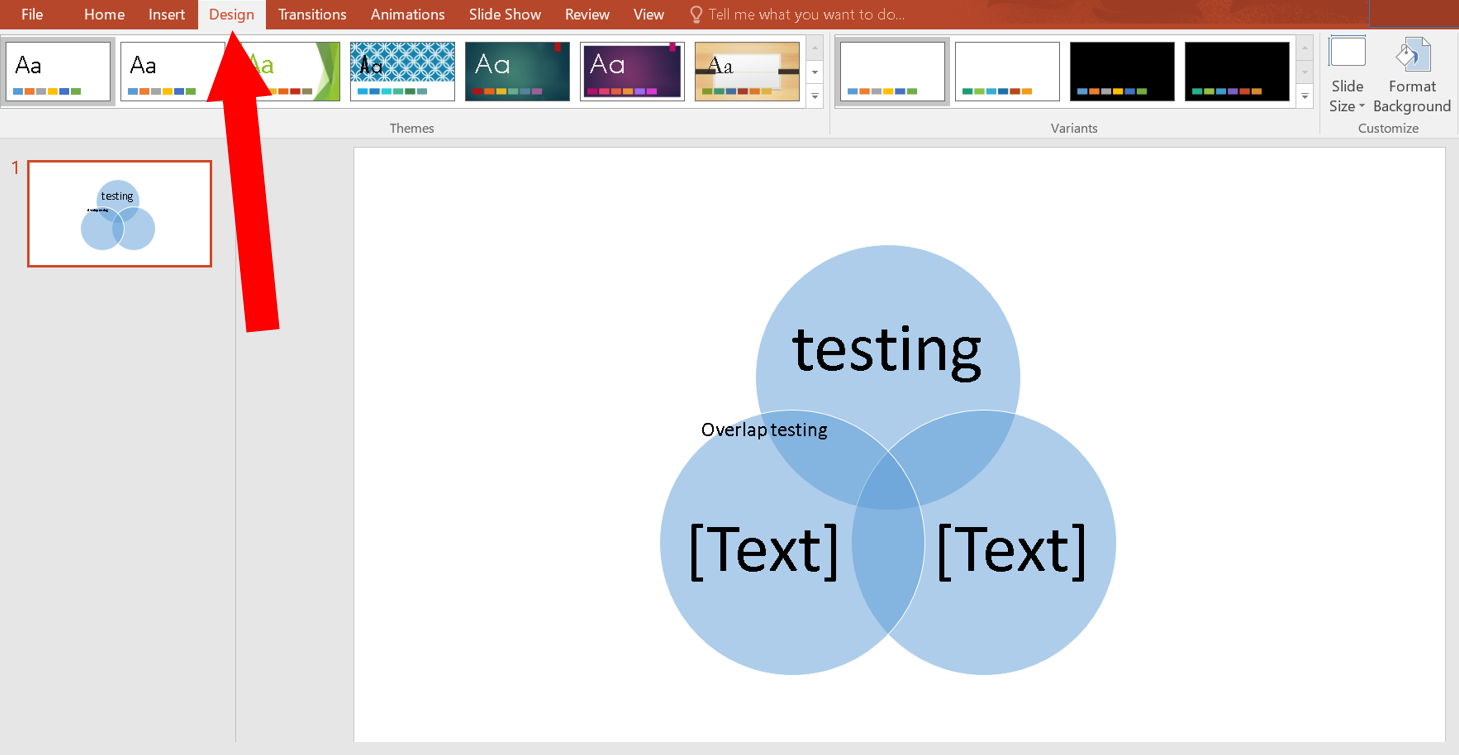
6. Coloring Circles.
PowerPoint allows users to add colors to their Venn diagrams. Not only does this make the diagrams more appealing, but it also makes them easier to understand.
Go to "SmartArt Tools" and select the "Design" tab. Click on "Change Colors." A drop-down menu will appear. Choose your preferred color scheme.
Additionally, you can choose separate colors for each circle to make your circles more distinct. Right-click a circle and choose "Format Shape."
When the "Format Shape" window comes up, go to the "Shape Options" tab and select "Fill." The box to the right of "Color" will reveal a palette from which you can choose your preferred color.

Check out these stunning geometry infographics.
History of Venn Diagrams.
The Venn diagram was popularized in the late 1800s thanks to the work of an English mathematician, John Venn, from who it got its name. John Venn wrote about the diagram in an article titled "On the Diagrammatic and Mechanical Representation of Propositions and Reasonings."
However, these diagrams had been around for much longer. Scholars such as Ramon Llull and Gottfried Wilhelm von Leibnitz drew similar diagrams long before John. The Euler diagrams by Euler Leonard are thought to have inspired John Venn.

Why You Should Use Venn Diagrams on PowerPoint.
Venn diagram circles can improve your PowerPoint presentations in several ways. Here are some of its top benefits:
- A Venn Diagram shows the relationship between two or more elements excellently
- It allows presenters to visually organize information
- It makes data easier to read
- It is easy to create
- It makes presentations more appealing and engaging
Introducing Iceberg PowerPoint templates.
Final Thoughts.
A simple Venn diagram is easy to create, but you will need more effort to create something stunning. If you don't want to waste valuable time creating your own Venn diagram online, you can get a Venn diagram template from us. Our Venn diagram templates are professionally-designed and easy to use. We also have several Venn diagram examples for you.
Frequently Asked Questions:
What is a Venn diagram in simple terms?
A Venn diagram illustrates the similarities and differences between two or more groups of things.
What program can I use to make a Venn diagram?
You can design a Venn diagram with Microsoft PowerPoint. However, Simple Slides' Venn diagram template is better than a Venn diagram maker.
Is a Venn diagram always three circles?
Though Venn diagrams usually consist of 2 or 3 circles, they can also have a higher number.

Related Articles:
Ideas for a PowerPoint Presentation
Get A Free Sample of Our Award-Winning PowerPoint Templates + University
Get A Free Sample of Our Award-Winning PowerPoint Templates + University
Join our mailing list to receive the latest news and updates from our team.
Don't worry, your information will not be shared.
We hate SPAM. We will never sell your information, for any reason.