2 Easy Methods to Create Venn Diagram: Google Slides Guide
May 24, 2023
Do you want to learn how to make a Venn diagram in Google Slides?
Show the relationship between two or more data sets by inserting a Venn diagram into your business presentations.
In this blog post, we will go through the following:
-
Create Venn diagrams by using diagrams in Google Slides
-
Create Venn diagrams by using the Shape tool
-
Frequently asked questions about making Venn diagrams in Google Slides presentations
 Method 1: Create Venn Diagrams by Using Diagrams in Google Slides
To create a Venn diagram by using the "Diagram" option in your Google Slides, follow these steps:
-
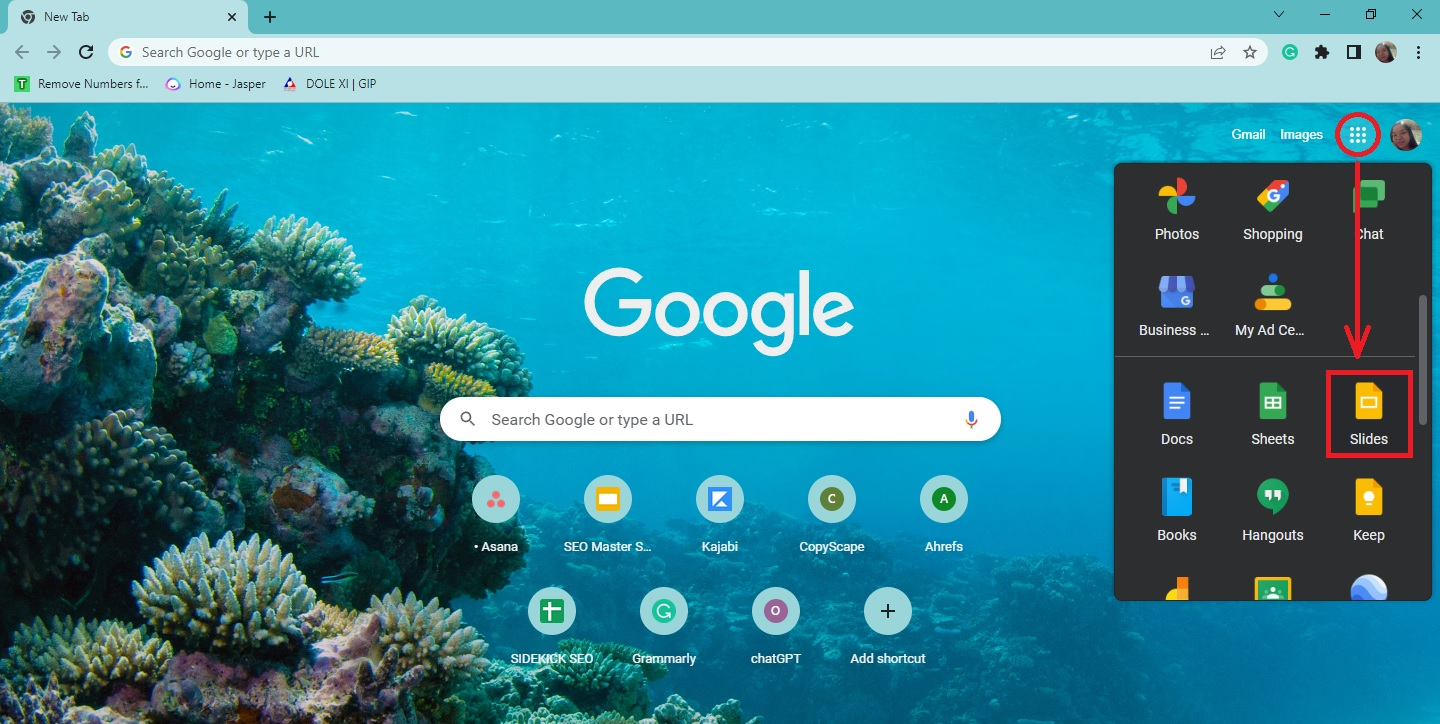
Open your Chrome browser, click "Google Apps," and select "Slides."
-
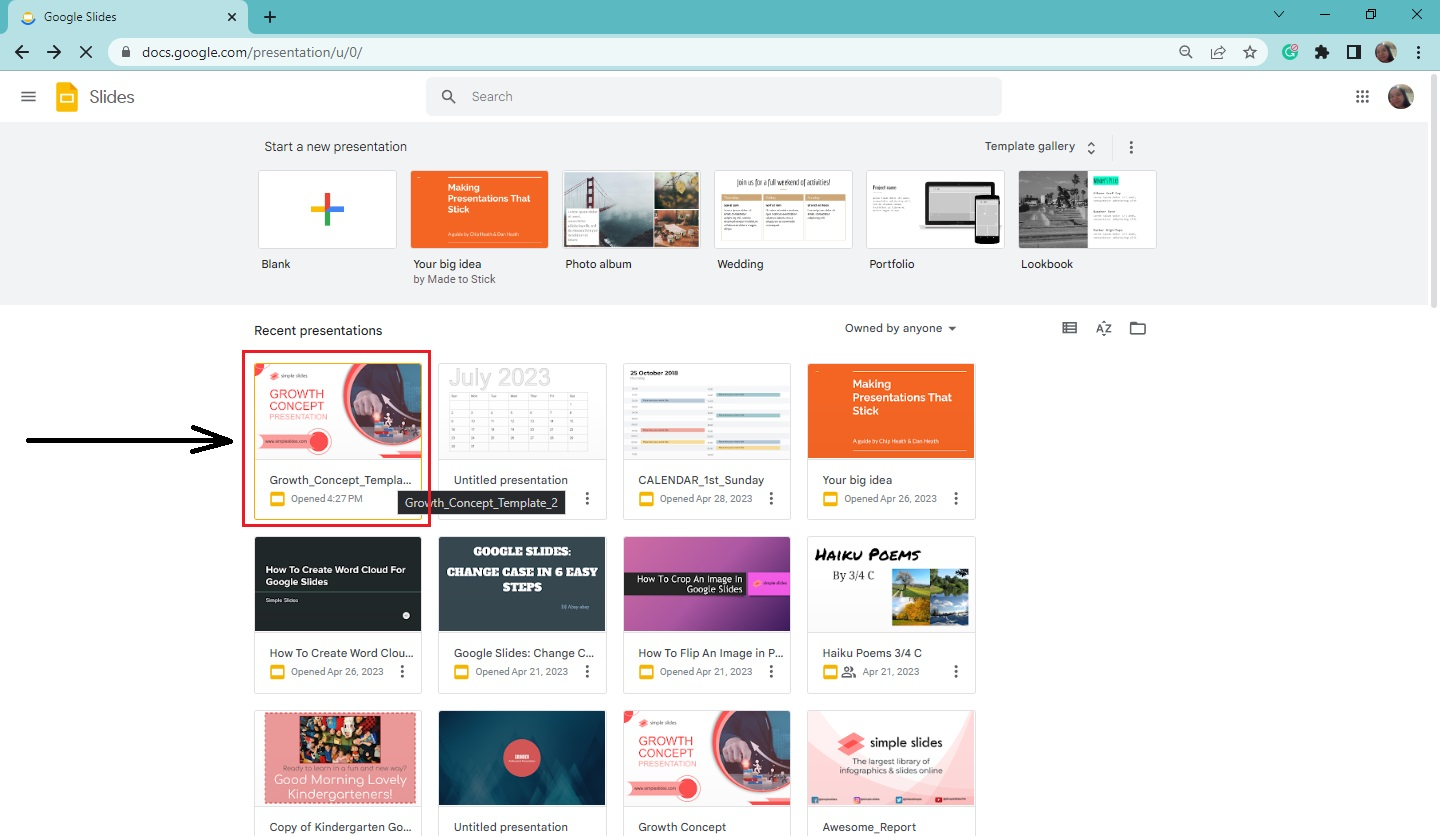
Choose an existing presentation where you want to create a Venn diagram.
-
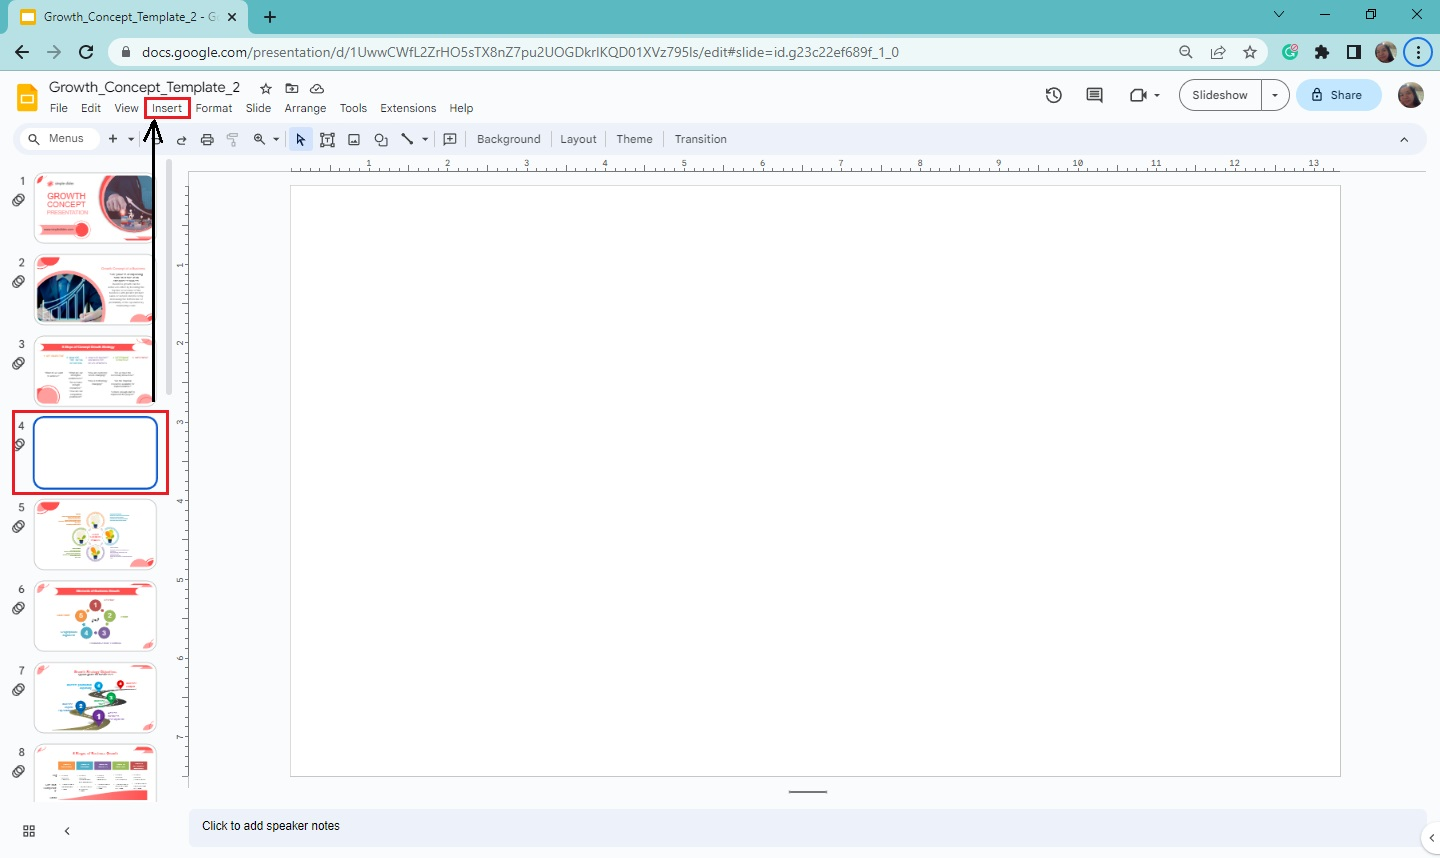
Select a specific presentation slide, then go to the "Insert" menu bar.
-
Select " Diagram " from the drop-down menu bar, and click "Relationship" from the pop-up menu.
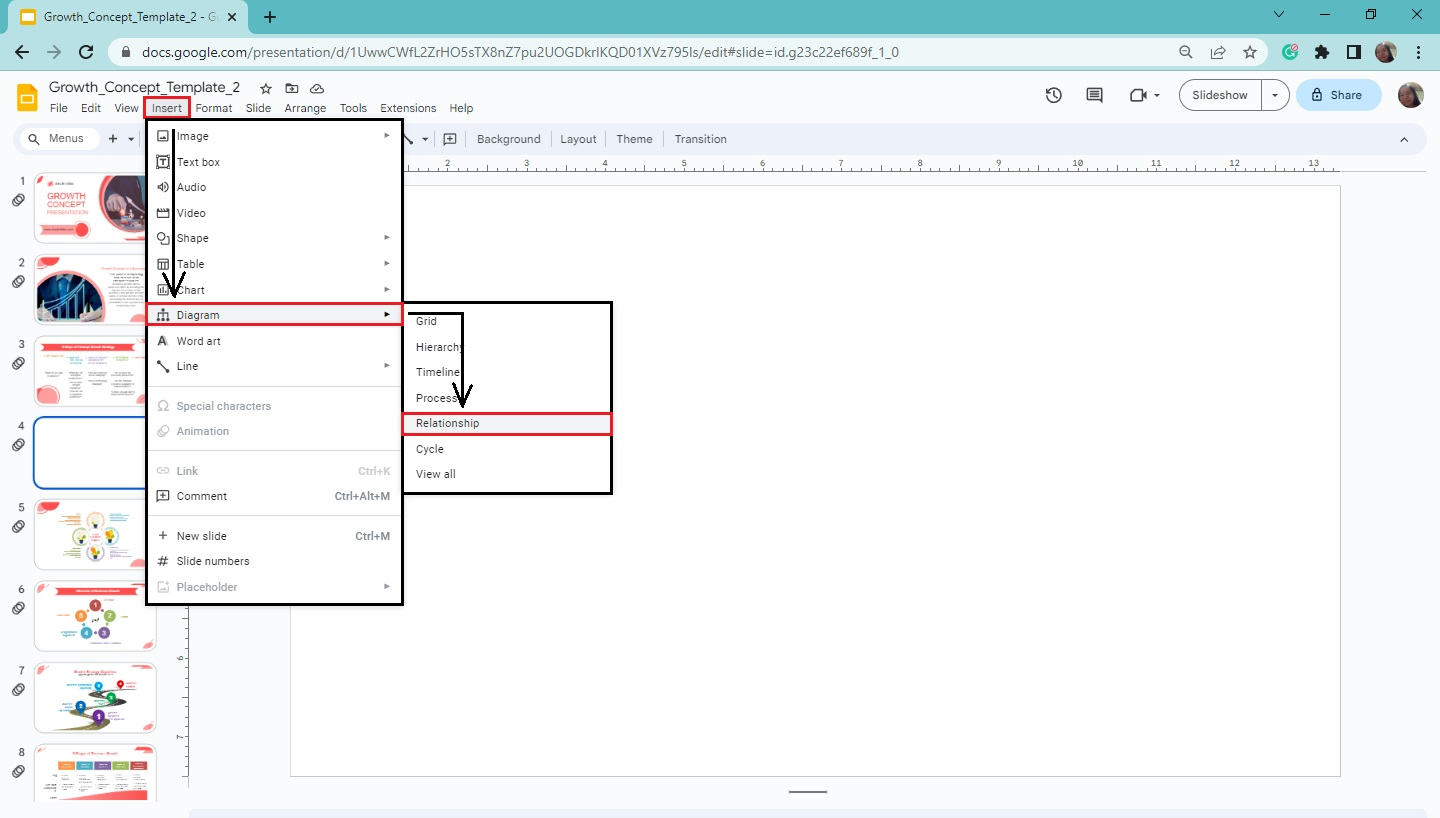
-
Select a specific Venn diagram layout once the "Relationship" pane appears at the right corner of your Google Slides.
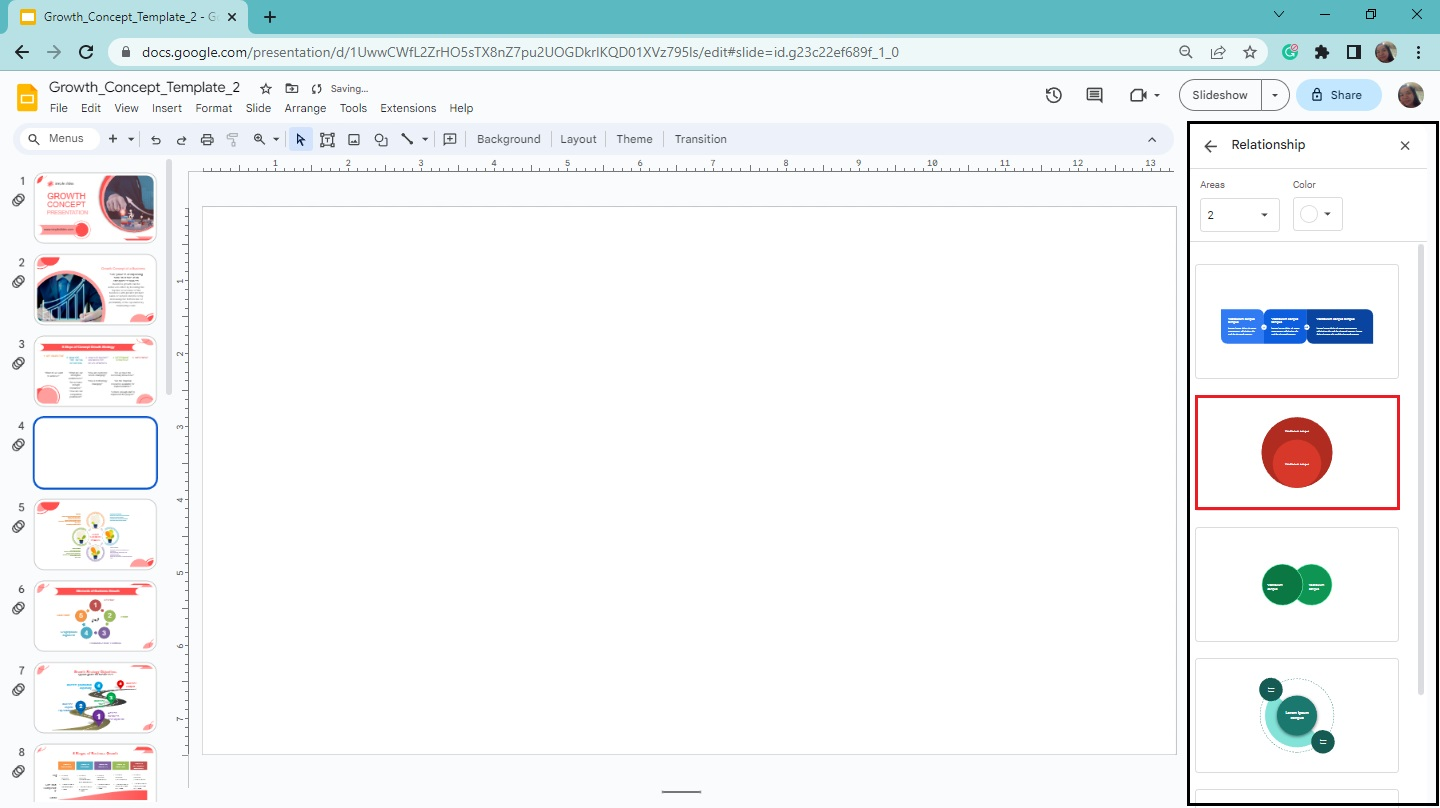
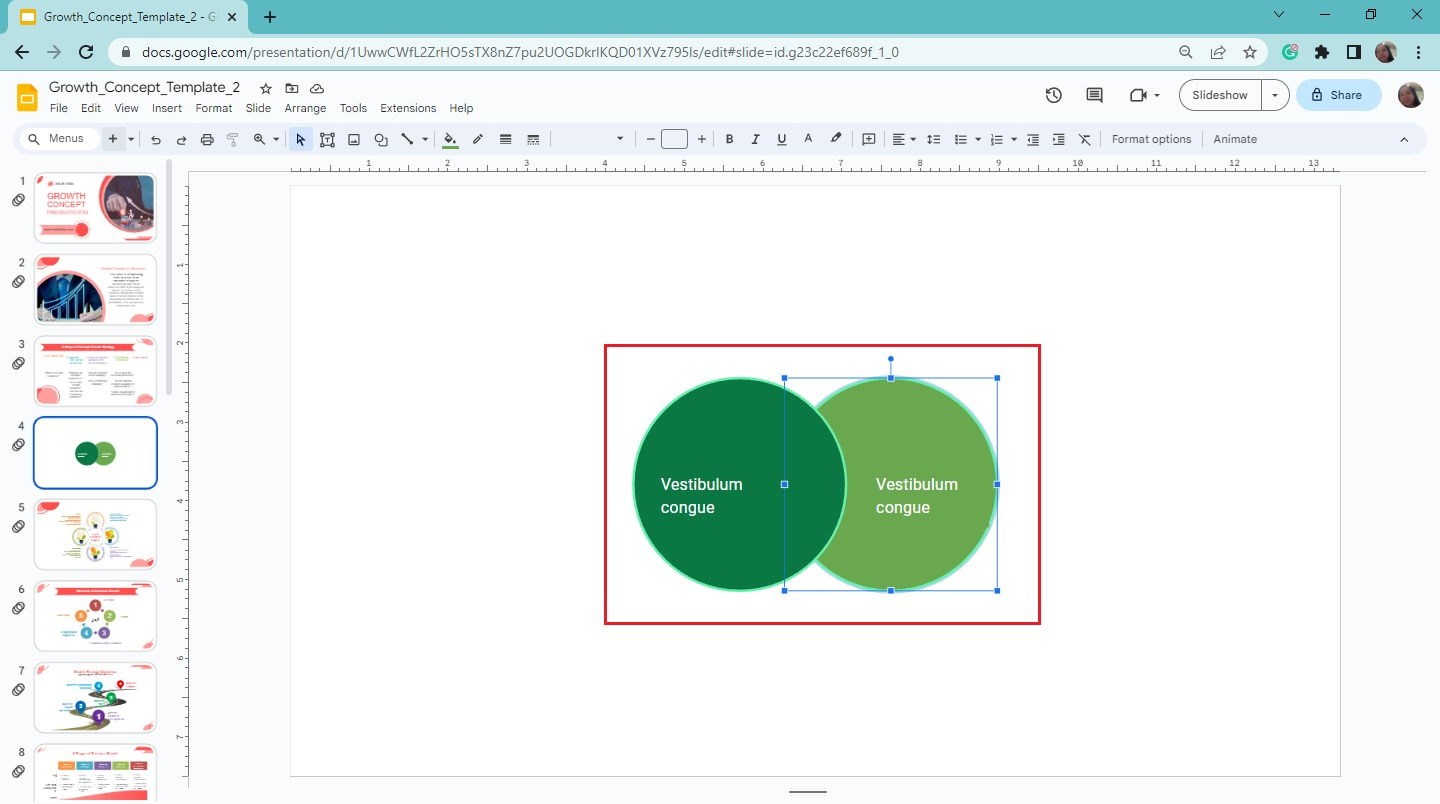
Once you click it, you have inserted a Venn diagram in Google Slides.
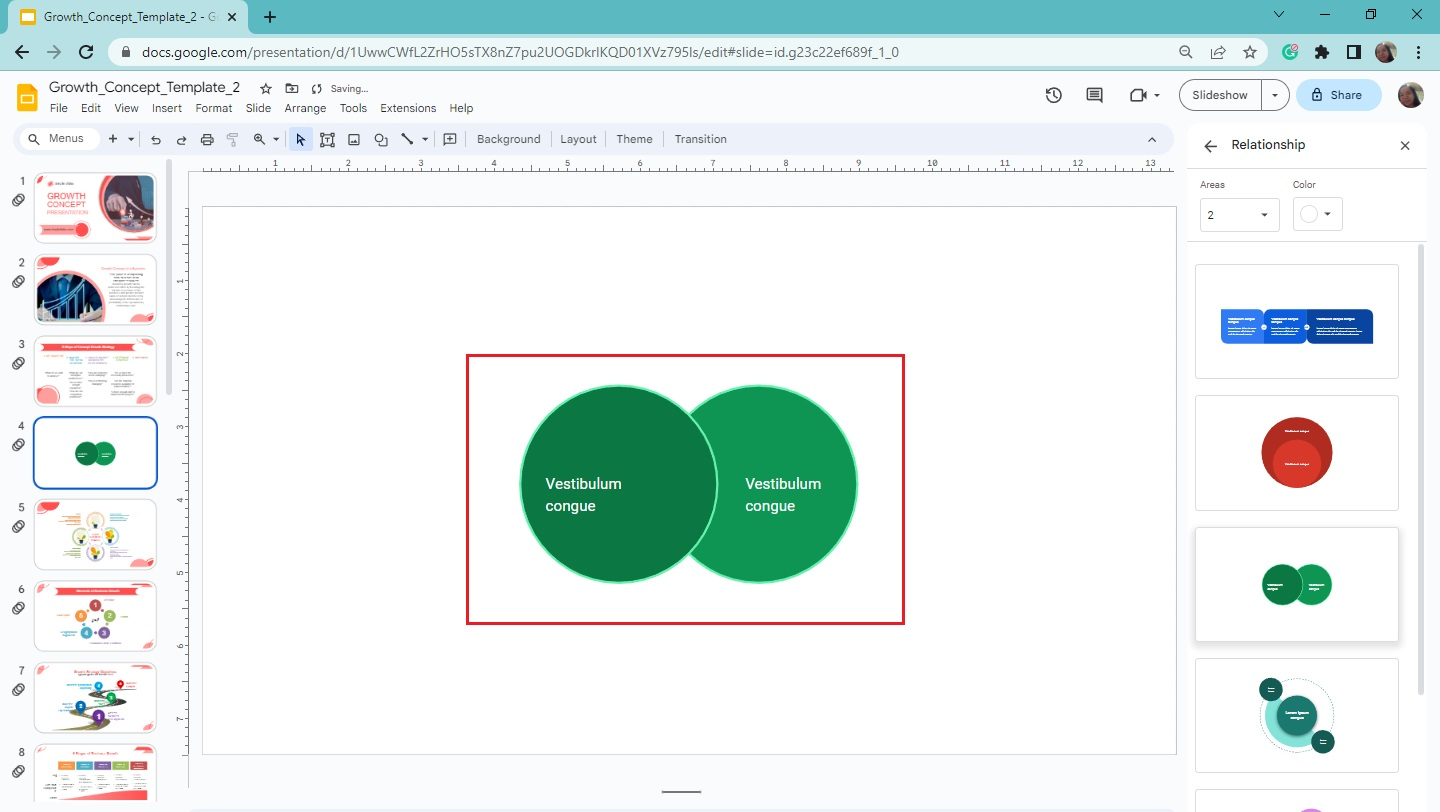
Customize your Venn diagram in Google Slides.
If you want to customize your Venn diagram in Google Slides, here's what you have to do:
-
Select a specific element of your Venn diagram on your Google Slides.
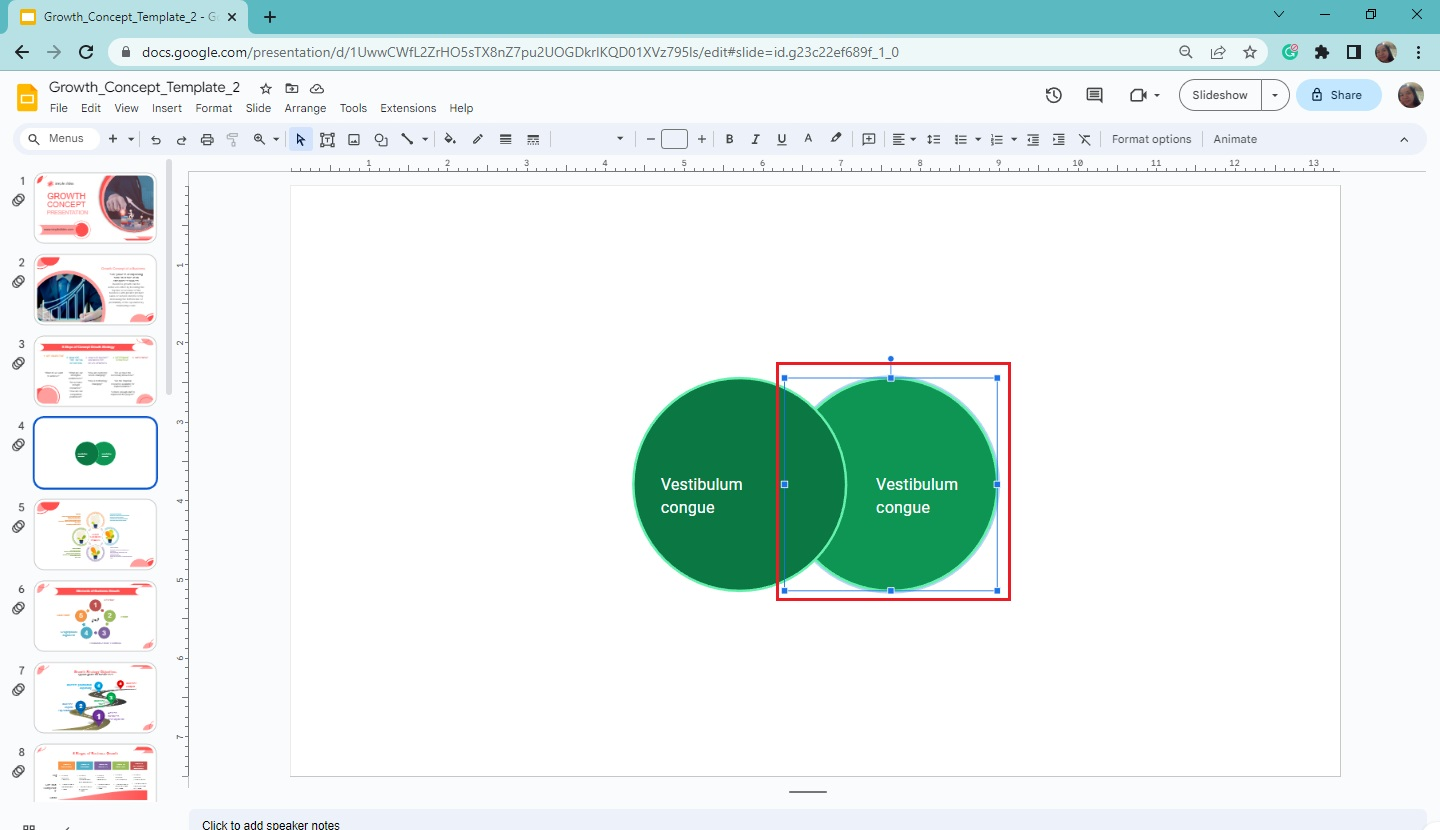
-
Then, click the "Fill color" to change the color scheme.
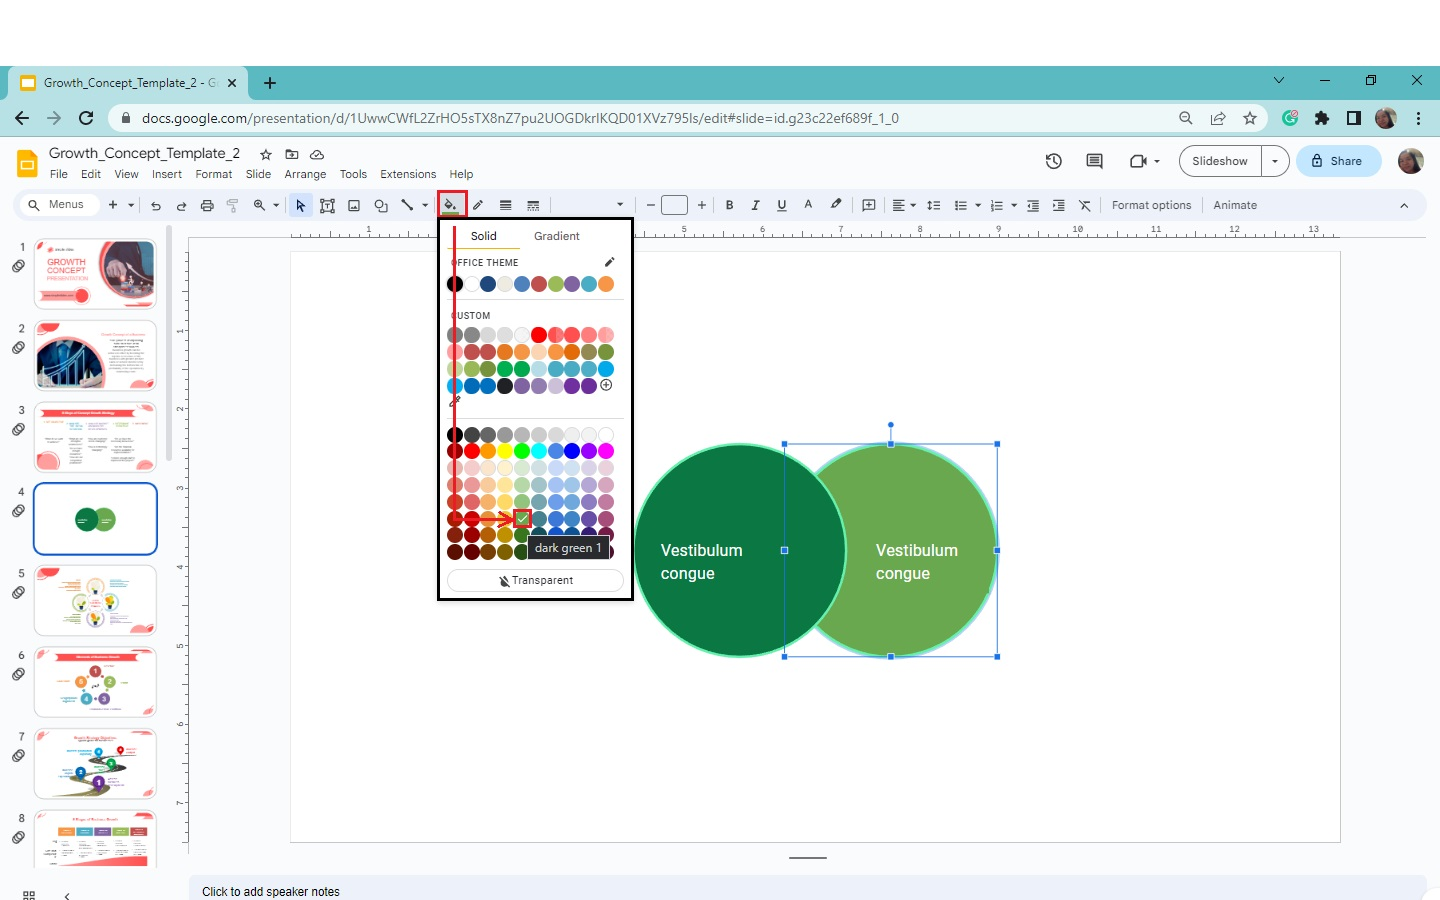
You have now customized your Venn diagram in your presentation slide.
Quick Tip: You can also change your element's background color, border color, and weight in your Venn diagram.
Method 2: Create Venn Diagrams by Using the Shape Tool
Another way to create a Venn diagram in Google Slides is using the Shape tool. To do that, you need to follow these steps:
-
Create a new presentation slide on your existing Google Slides.
-
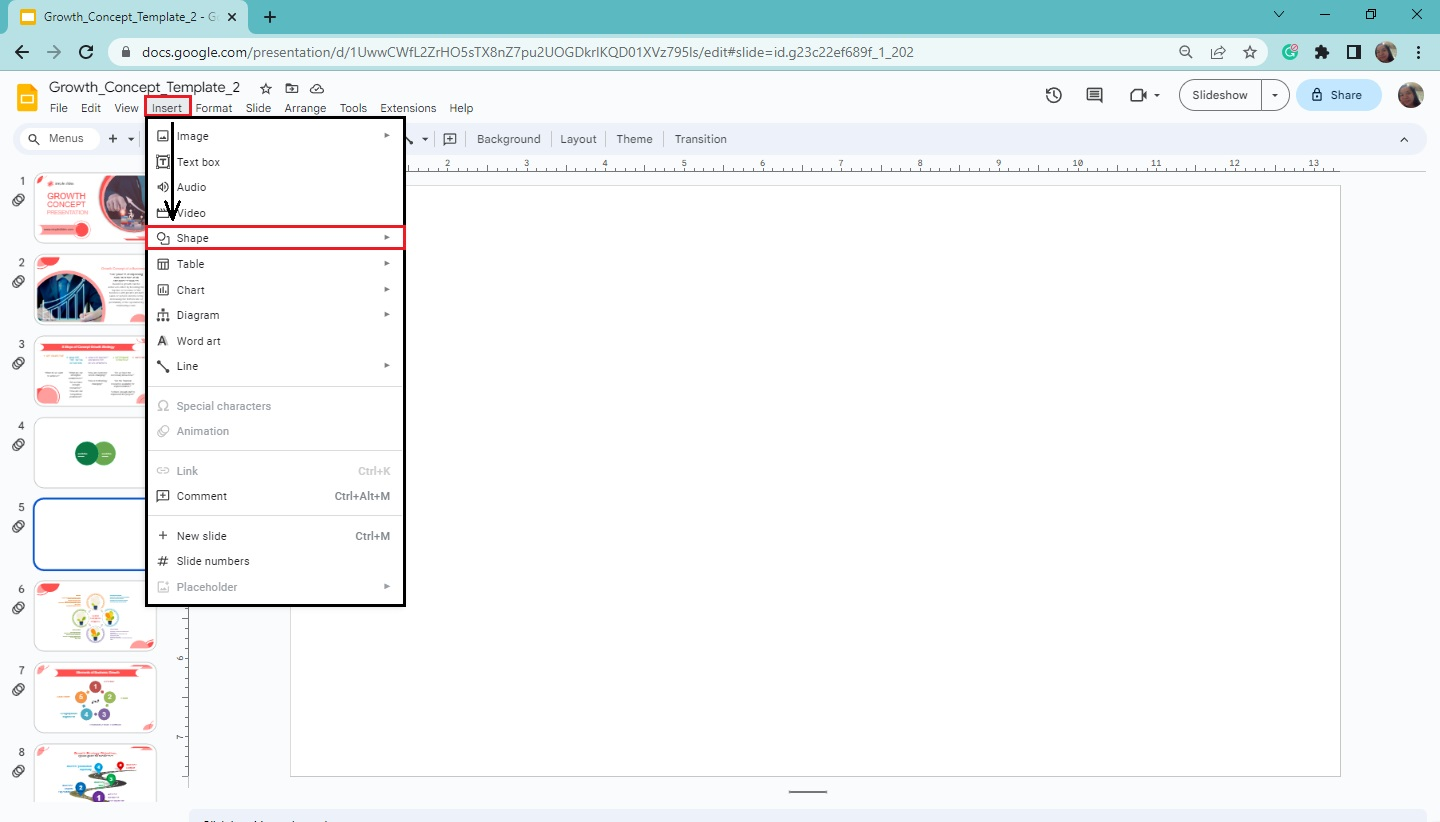
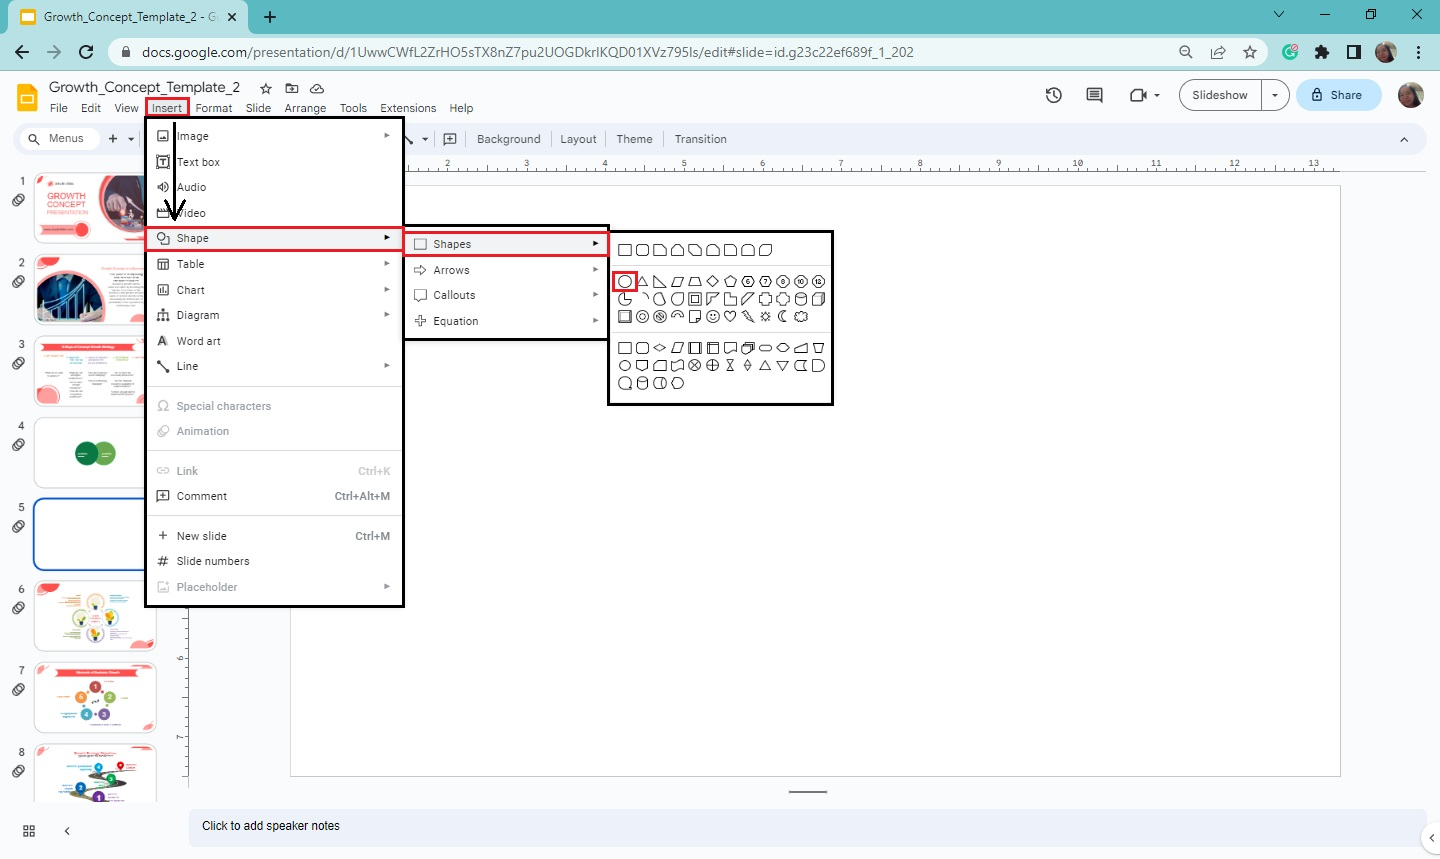
Go to the "Insert" menu bar, and click "Shape" from the drop-down menu.
-
Select " Shapes " from the pop-up menu and click the "circle."
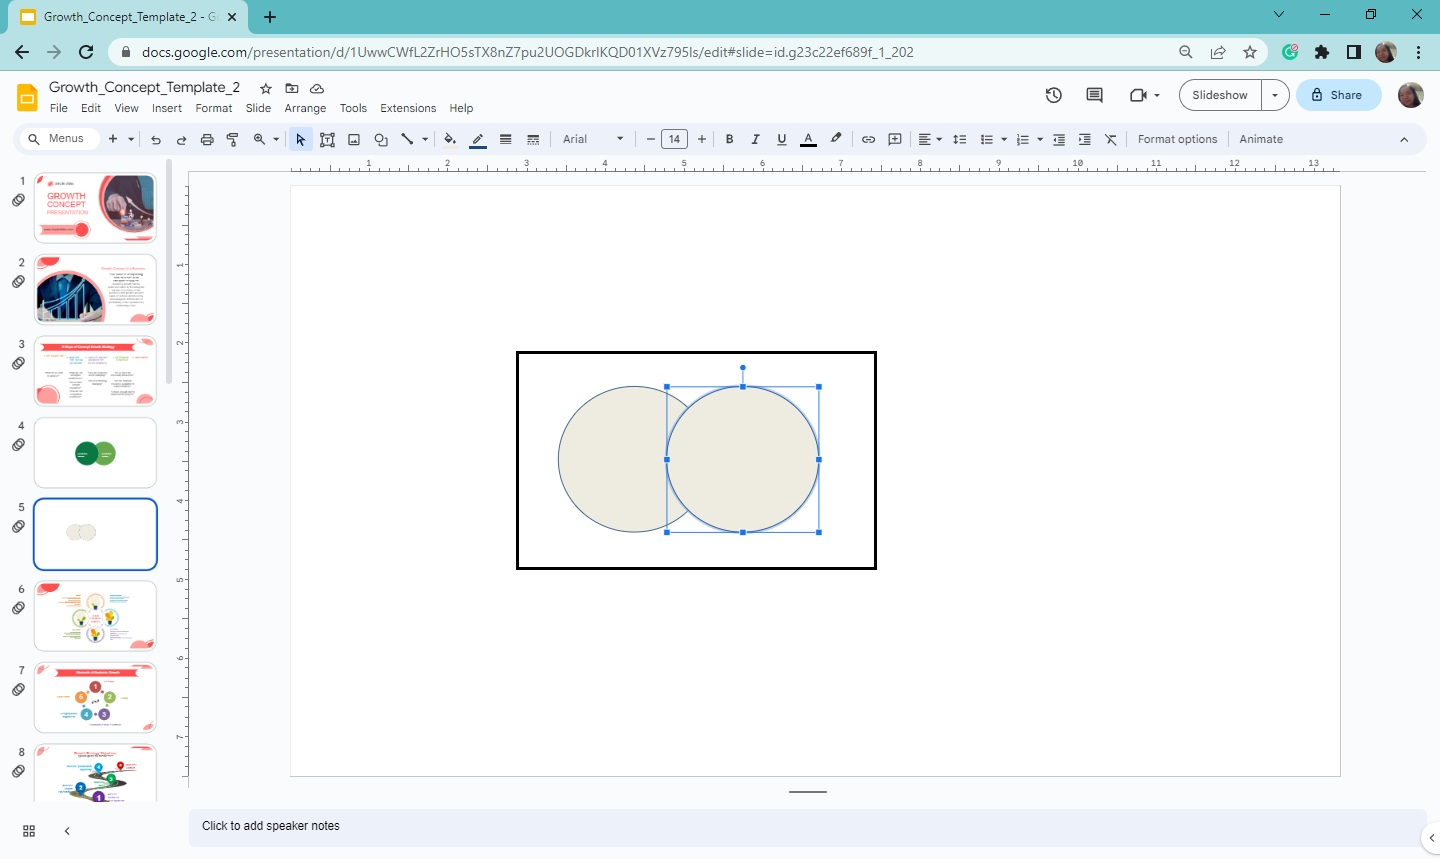
-
Click and drag the first circle on your presentation slide. Then, copy and paste the same circle until you create a Venn diagram.
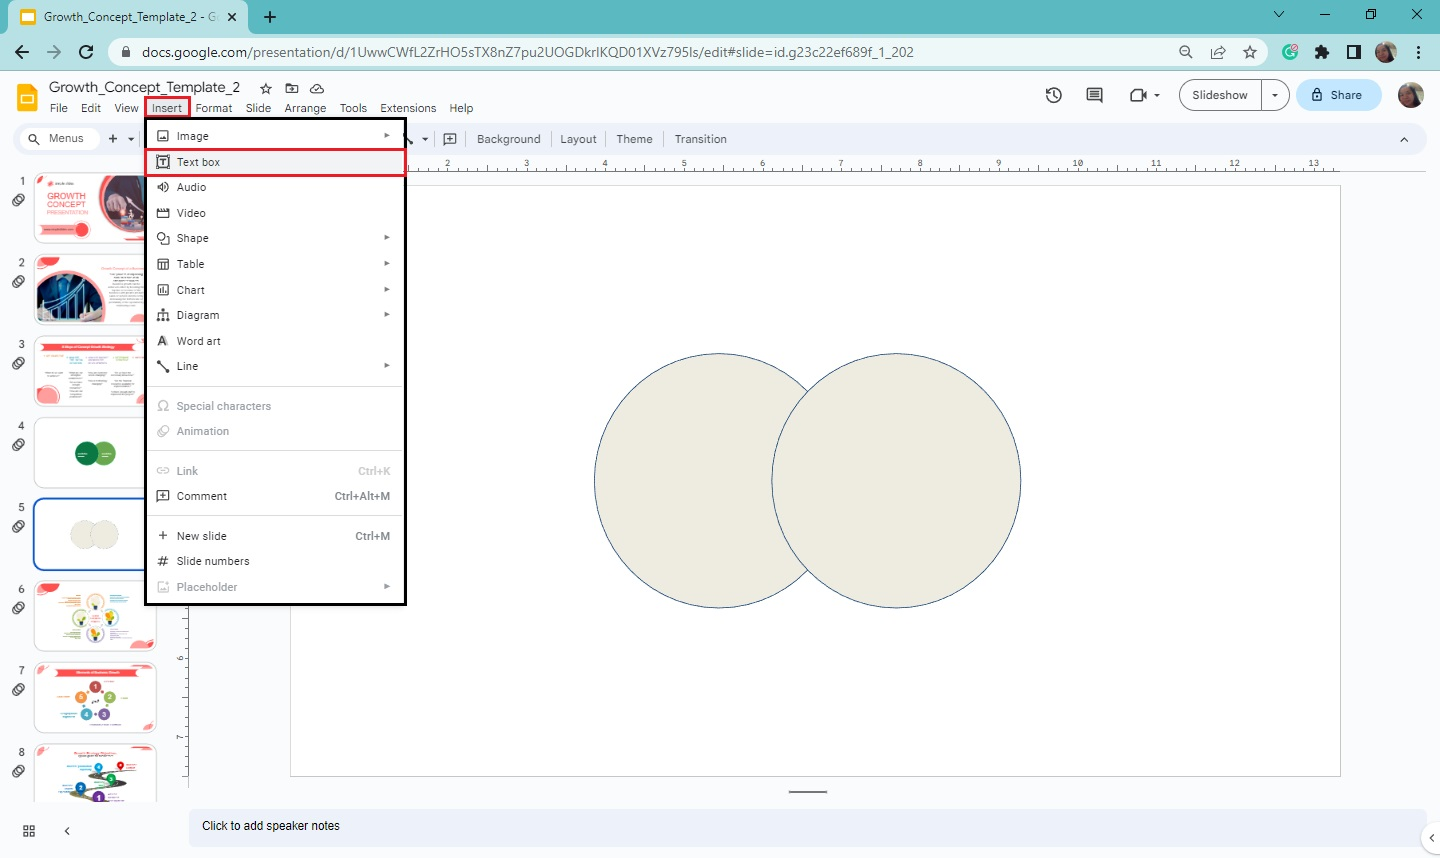
-
Then, go to the "Insert" menu and select "text box" to insert text into your diagram.
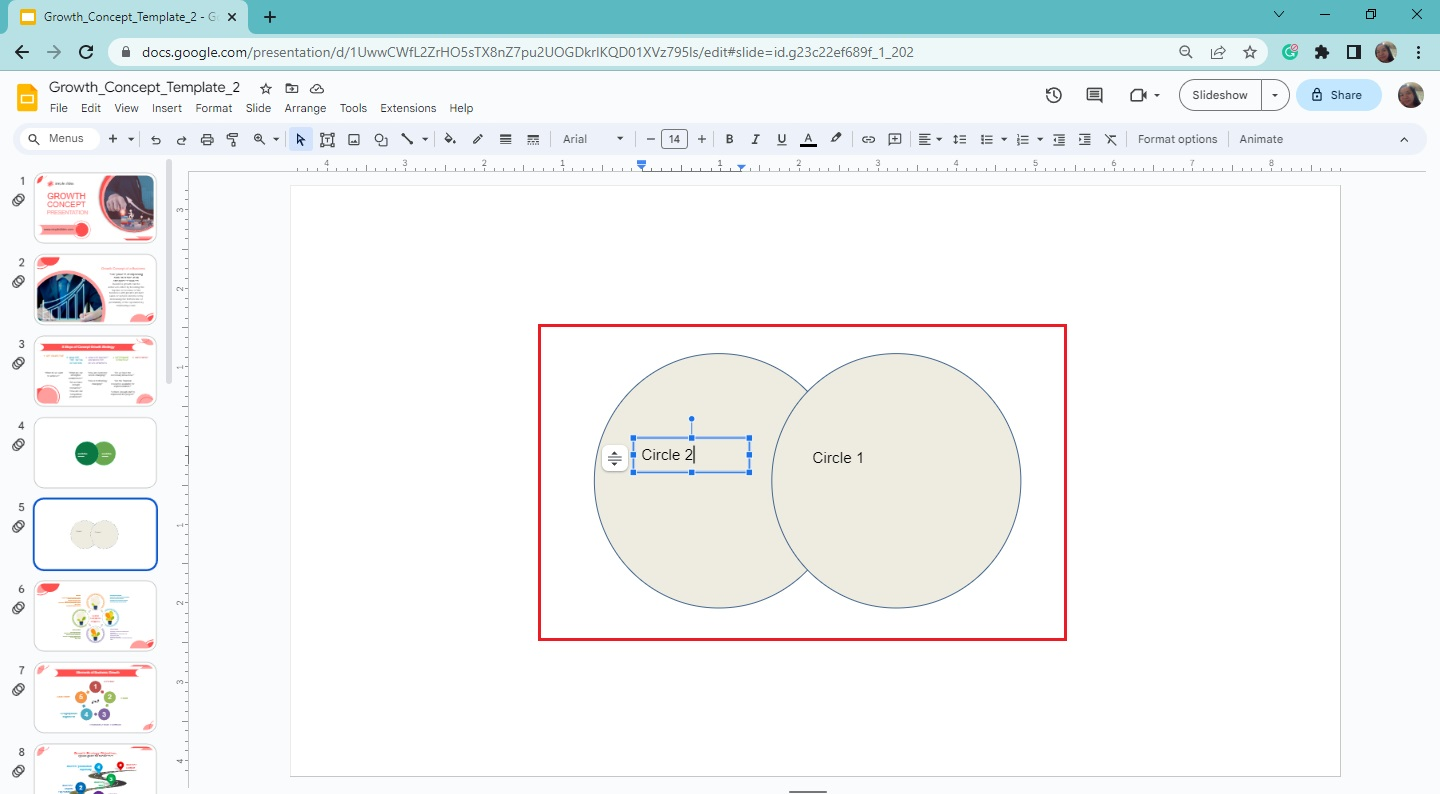
-
Once you've done that, you'll have a newly created Venn diagram in Google Slides.
Quick Tip: Hold down the Shift key while making a circle to your Venn diagram to make a perfect shape on your Google slide presentation.
You can find detailed instructions in our guide on inserting diagrams in Google Slides.
Final Thoughts on How to Create Venn Diagrams on Google Slides
Using one of the methods we shared, you'd be able to highlight the similarities and differences between your data sets.
Don't forget to subscribe to the Simple Slides YouTube channel to watch Google Slides tutorials for free. Access over 10,000 infographics, templates, and slides by signing up for a Simple Slides subscription plan!
Frequently Asked Questions about Making Venn Diagrams in Google Slides Presentations:
Can I draw Venn diagrams on Google Docs?
You can also use the Shape tool to create a Venn diagram in Google Docs. Moreover, you can easily insert a chart template from Google Sheets into your document.
What is the use of a Venn diagram in Google Slides presentations?
A Venn diagram in your presentation lets people easily comprehend complex ideas, including subsets and data relationships.
How do I group the overlapping circles of my Venn diagram in Google Slides?
Click or highlight all the overlapping circles, then right-click the selection. From the context menu, select Group.
Related Articles:
How To Reuse Slides In Google Slides: A Step-By-Step Guide
Learn How To Insert Icons In Google Slides In 8 Simple Steps!
How To Add a Comment On Google Slides in 6 Easy Steps
Get A Free Sample of Our Award-Winning PowerPoint Templates + University
Get A Free Sample of Our Award-Winning PowerPoint Templates + University
Join our mailing list to receive the latest news and updates from our team.
Don't worry, your information will not be shared.
We hate SPAM. We will never sell your information, for any reason.