
Learn How To Insert a Diagram In Google Slides
Mar 20, 2023
Do you want to showcase statistical data on your Google Slides but don't know how?
Inserting a diagram in Google Slides will allow you to make clear and concise PowerPoint presentations that your audience will love.
In this article, we will walk through the following:
-
How to add diagrams to your Google Slides presentation.
-
How to customize your diagrams in Google Slides.
-
How to edit your data labels in a diagram.
-
How to add and arrange your diagrams.

Insert Diagrams on Google Slides? Here's How!
Add diagrams to your Google Slides presentation.
To insert a diagrammatic data representation in your presentation:
-
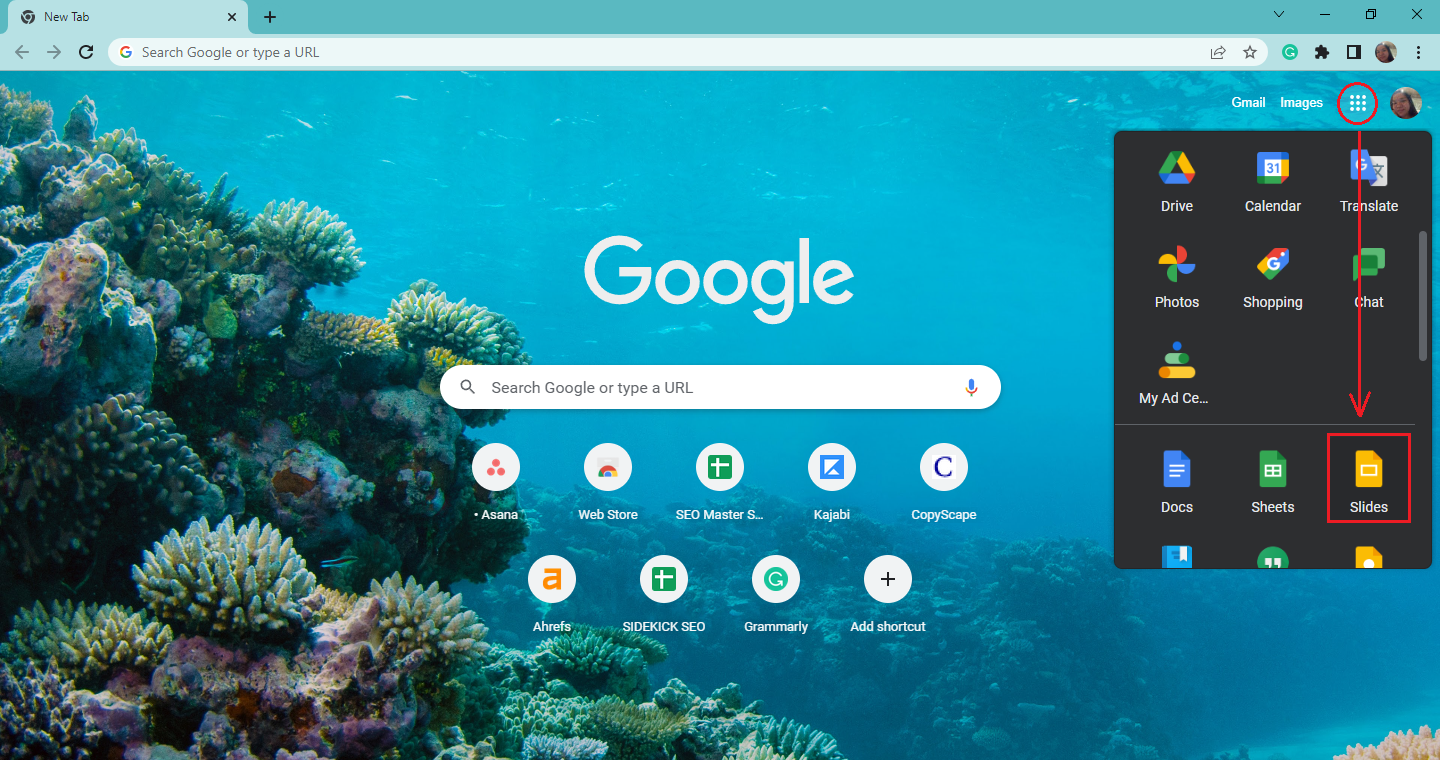
Open a new Google Chrome tab, click Google app, and select Google Slides.
-
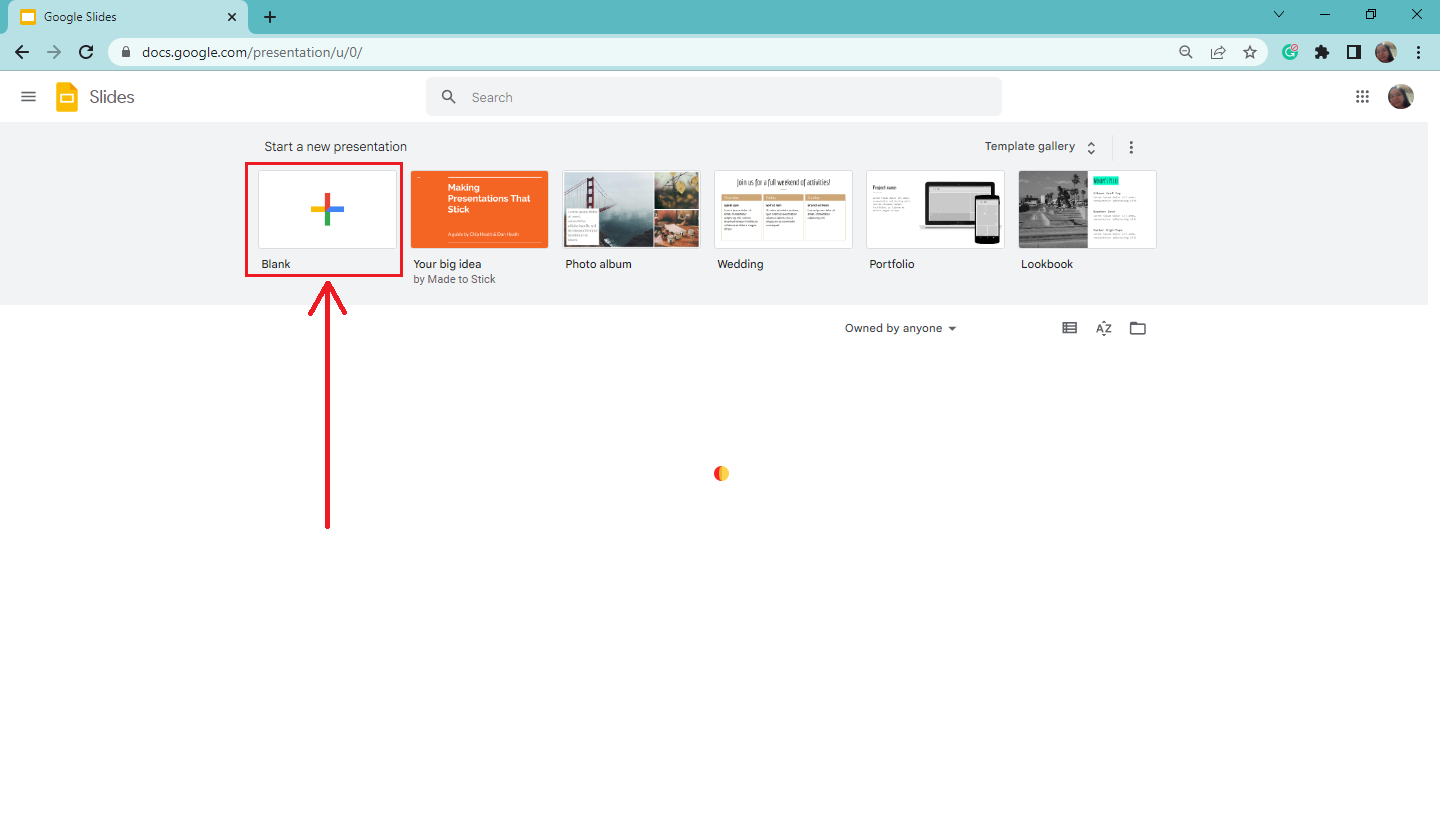
In the Google Slides tab, click the "blank presentation."
-
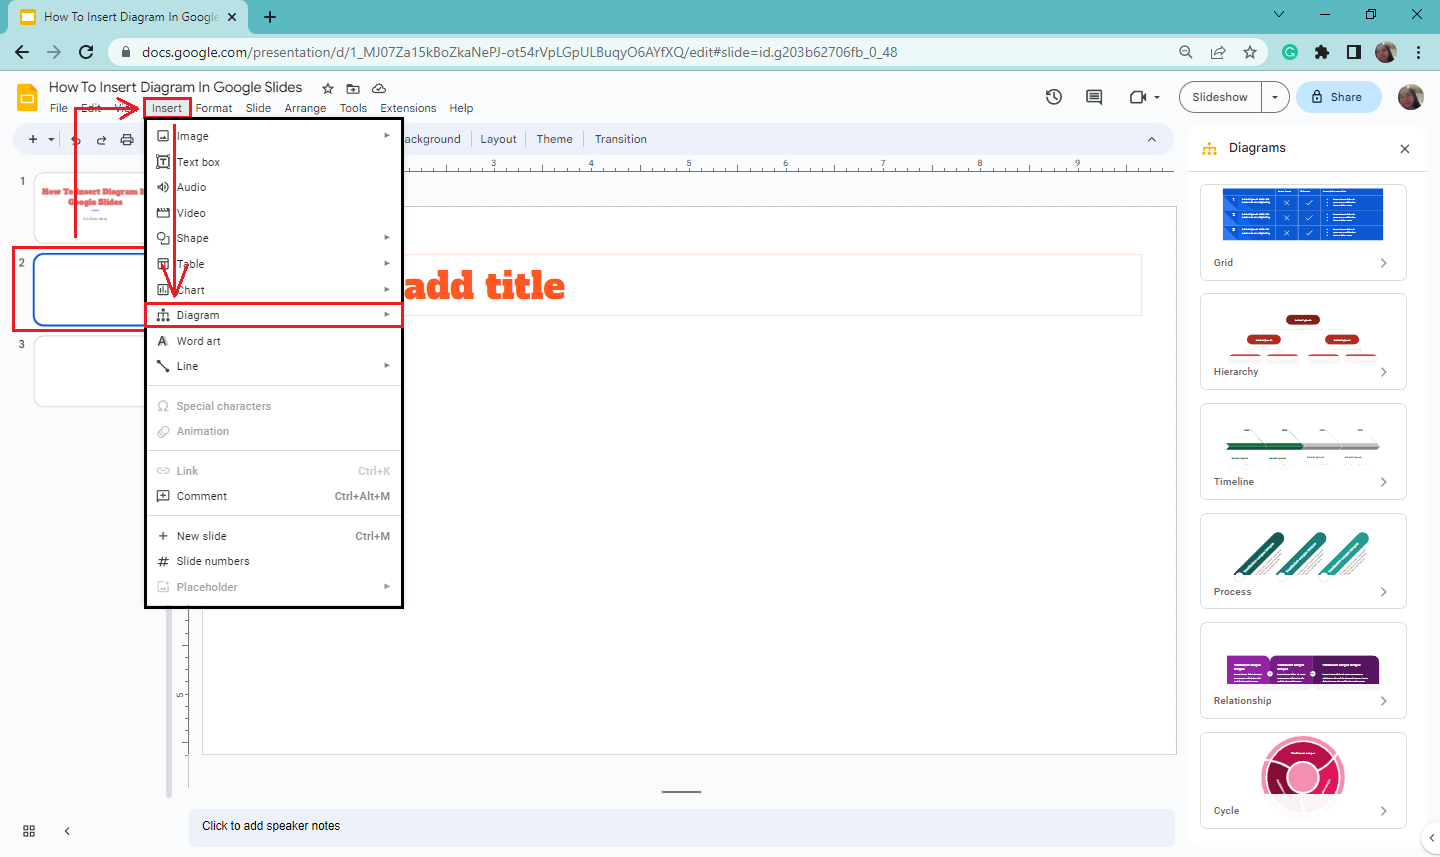
Select a slide where you want to create diagrams on your Google Slides. Then, go to the "Insert" tab, and click "Diagram" in the drop-down menu.
-
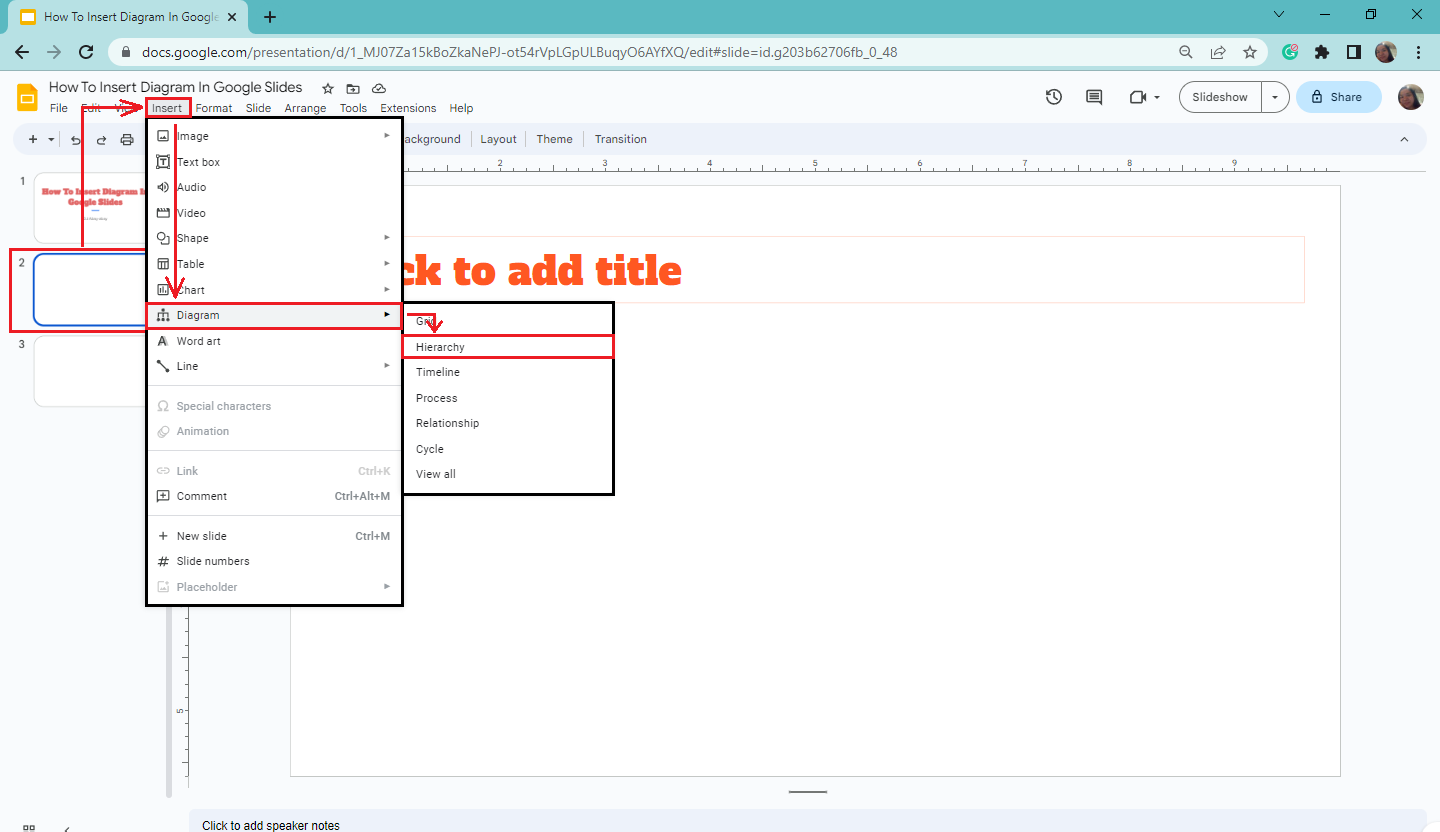
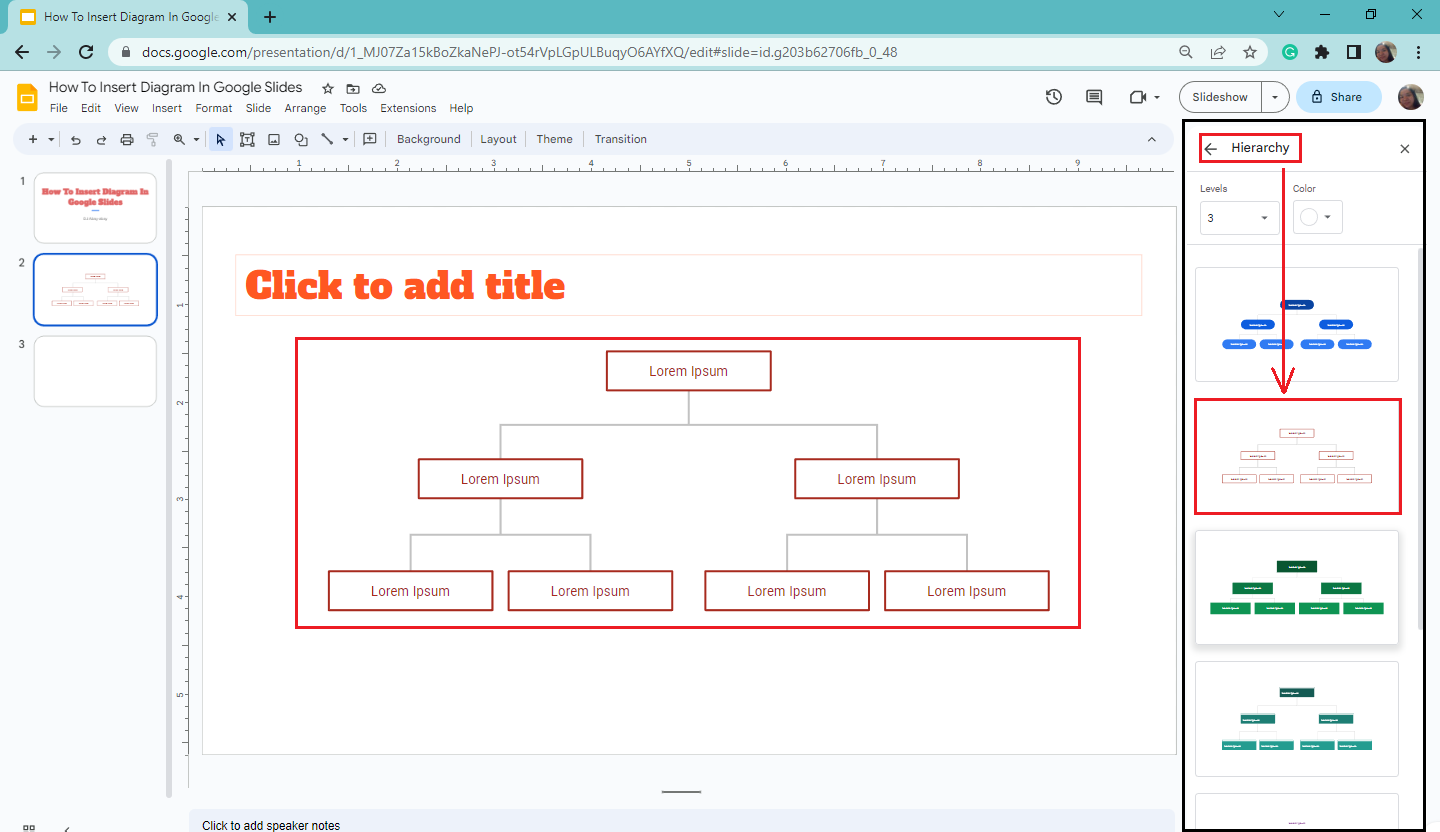
Select from the drop-down menu option which diagrams you want to use in your Google Slides presentation. For this example, we chose Hierarchy.
-
When the "Hierarchy" pane appears on the right side of your presentation, navigate and select a style for your diagram.

-
Once you click a specific style, your particular "Hierarchy" diagram will appear on the specific slide on your Google Slides.
Customize your diagrams in Google Slides.
Suppose you want to customize your diagrams in your Google Slides presentation:
-
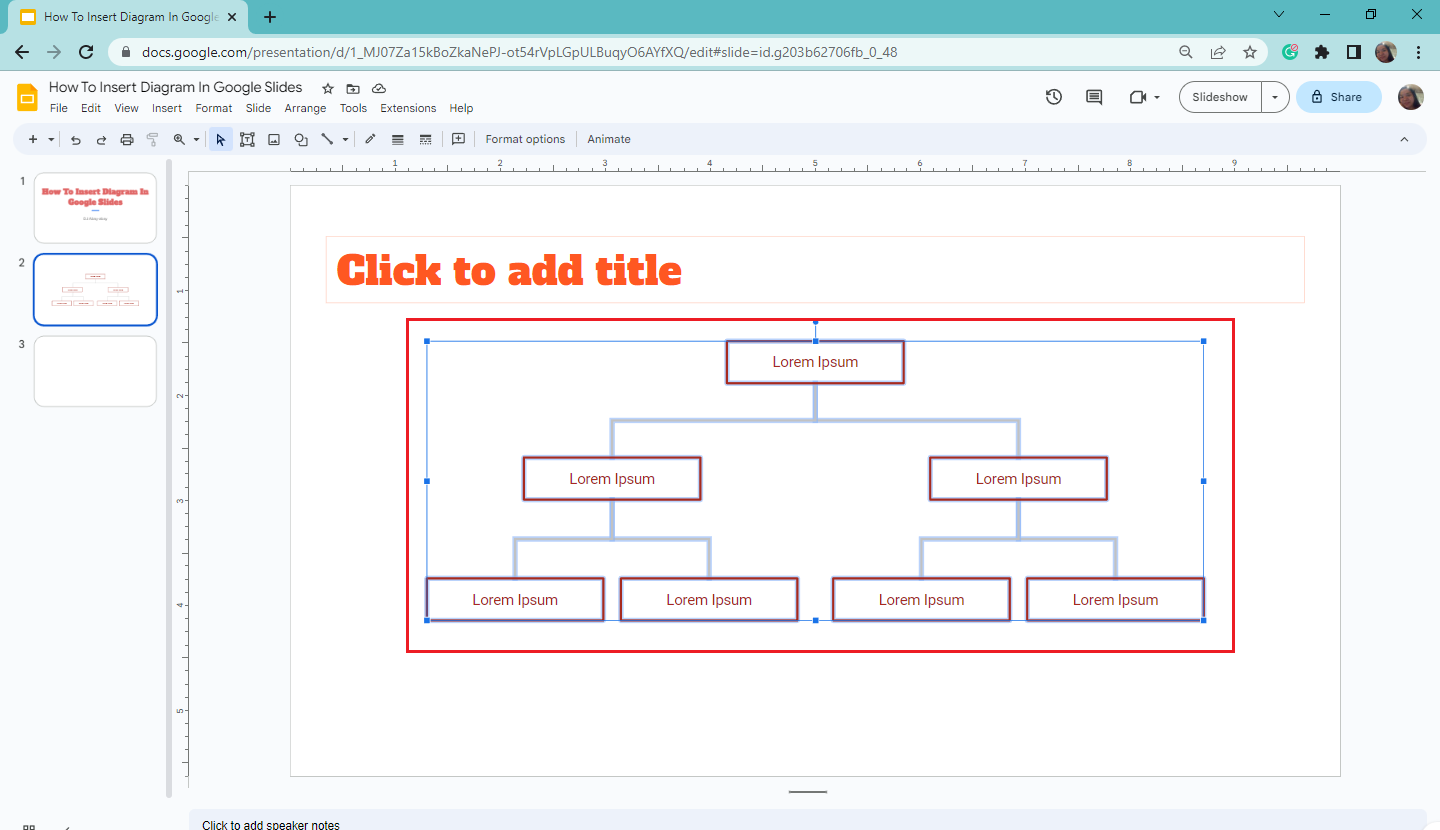
Click and highlight all the text boxes of your diagram.
-
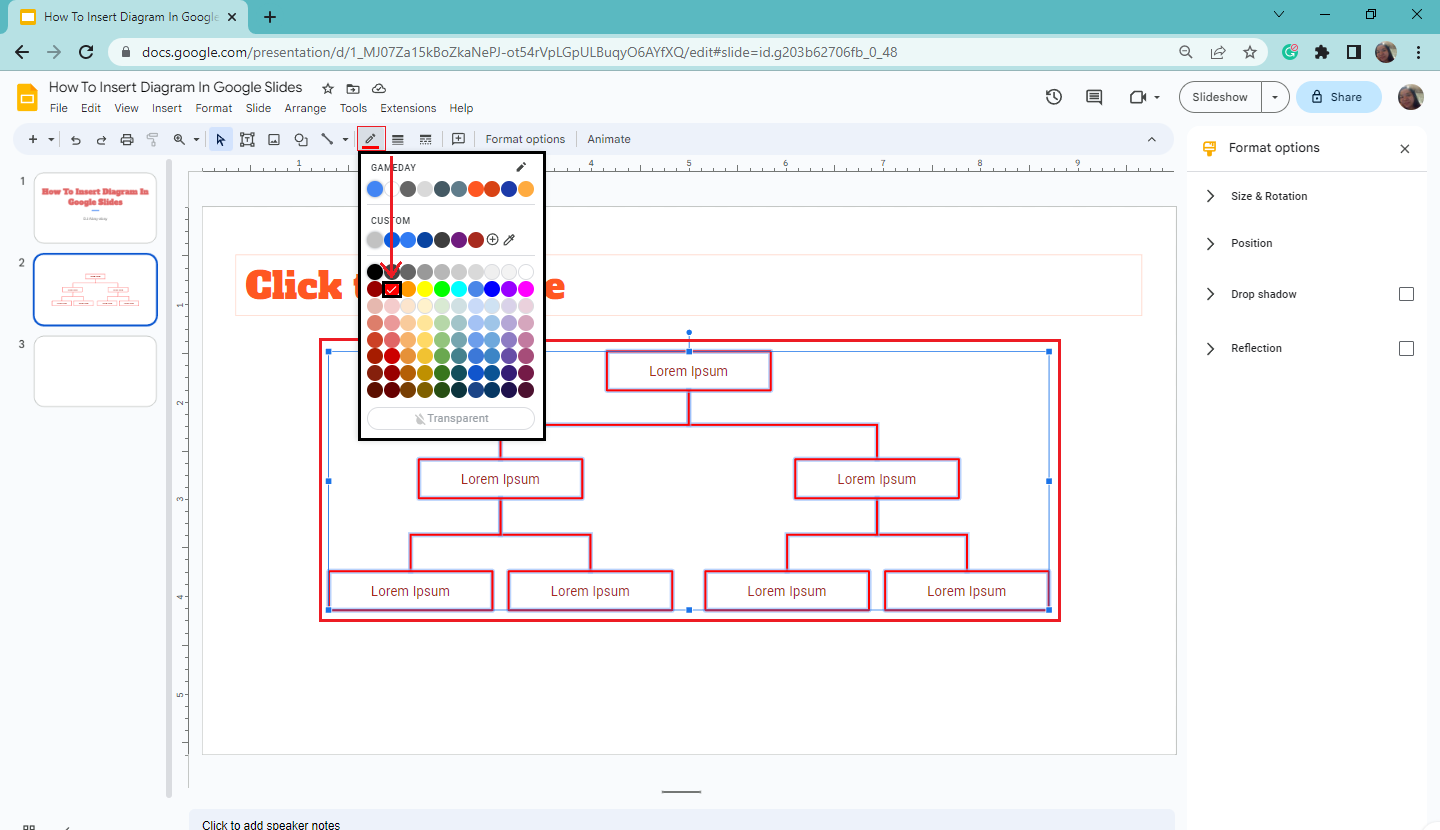
Navigate to the toolbar, E.G., If you want to change the text color or your diagram text box, select "Border Color" and choose a color you want to use in your presentation.
-
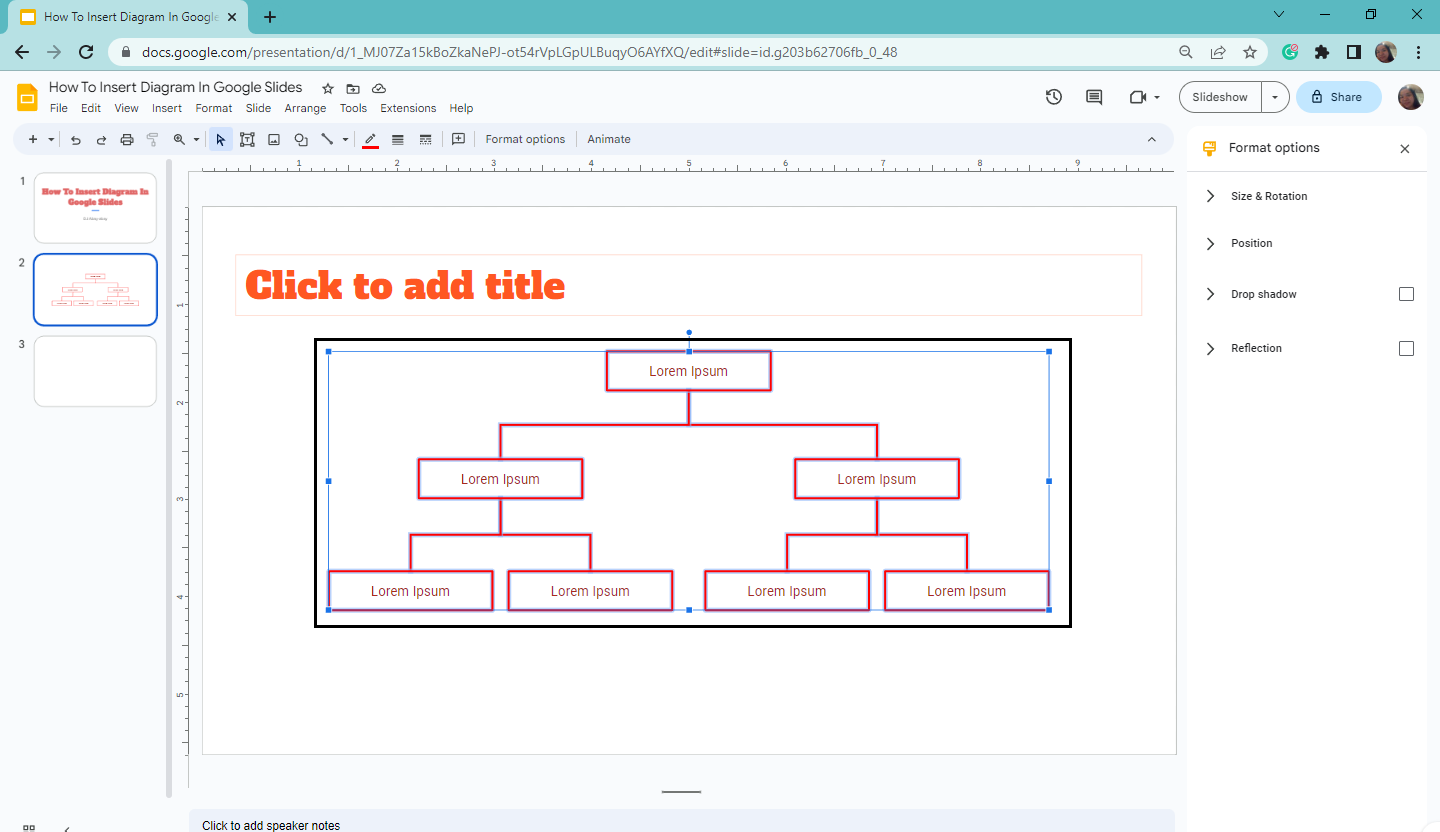
Once you select a color from the "Border Color" option in the toolbar, your specific color appears on your Google Slides.
Edit my data labels in the diagram.
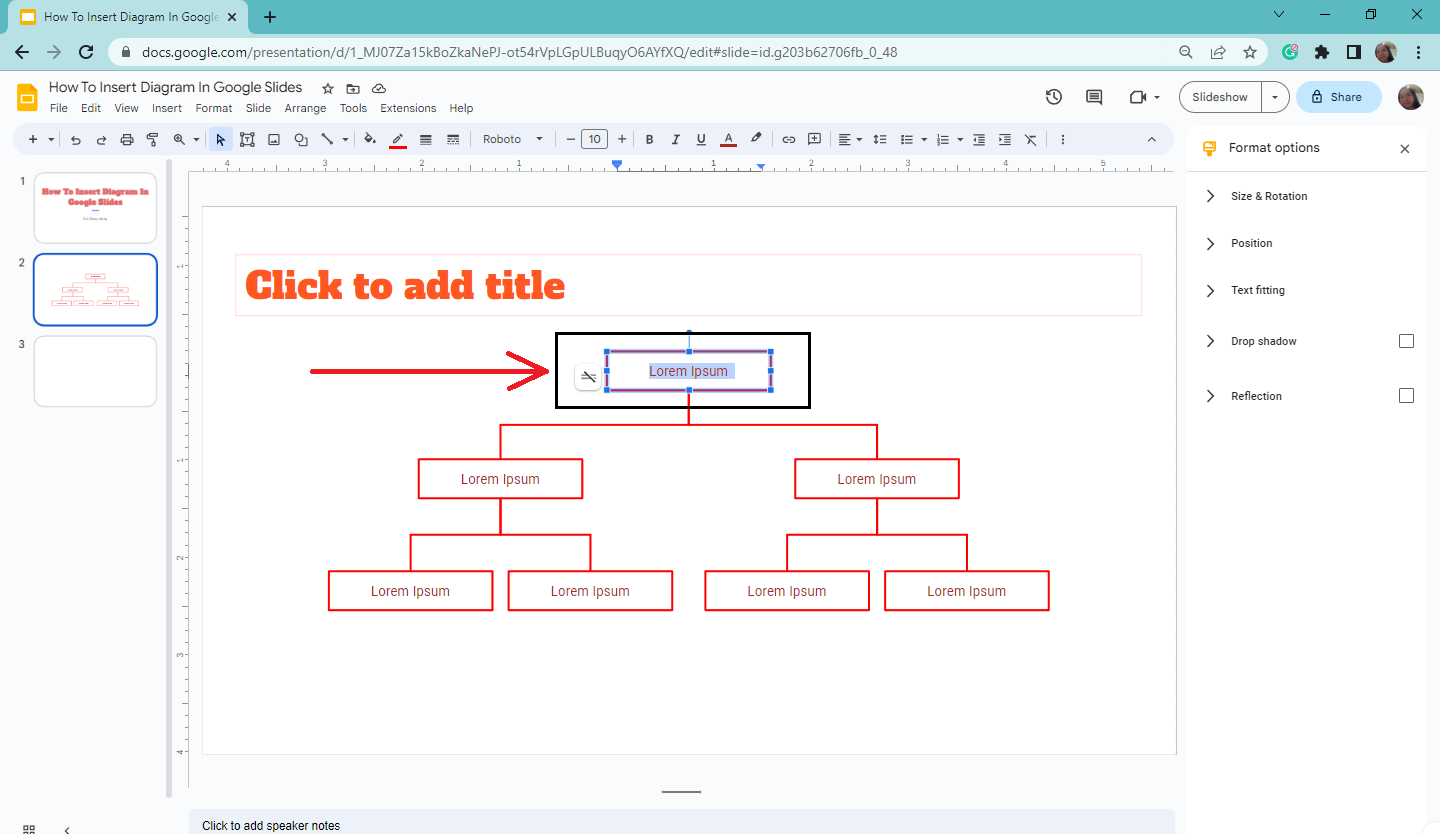
Suppose you input something irrelevant to your data representation and want to edit it:
-
Double-click the section in the text box.
-
Once you highlight the title text inside the text box, you can edit and start typing your desired data.
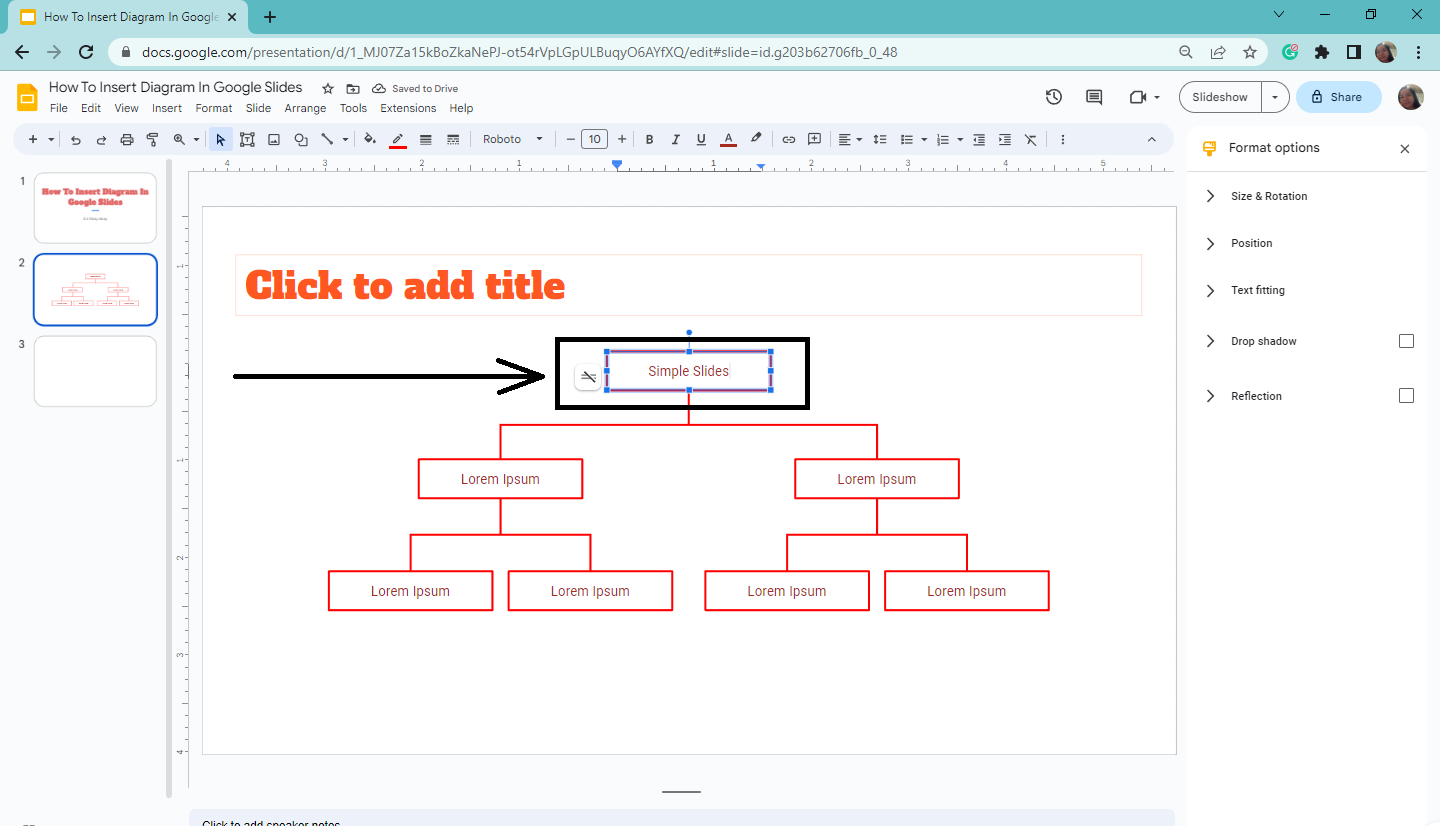
Add and arrange your diagrams.
To organize and add your statistical diagrams from your Google Slides presentation:
-
Select and drag an open section in your Google Slides.
-
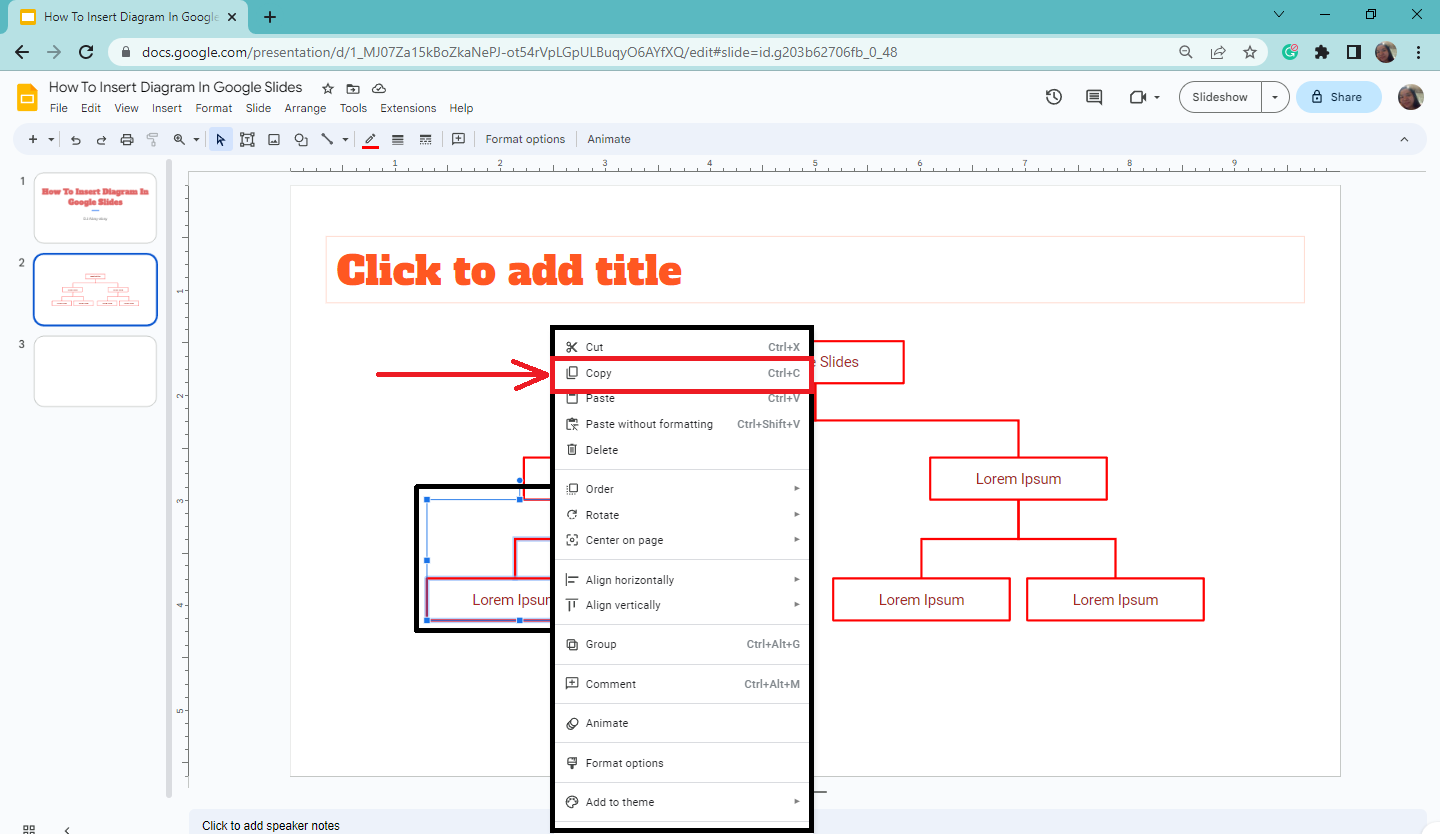
When the connector and the text are highlighted, right-click your cursor within the area and click "copy" in the pop-up menu.
-
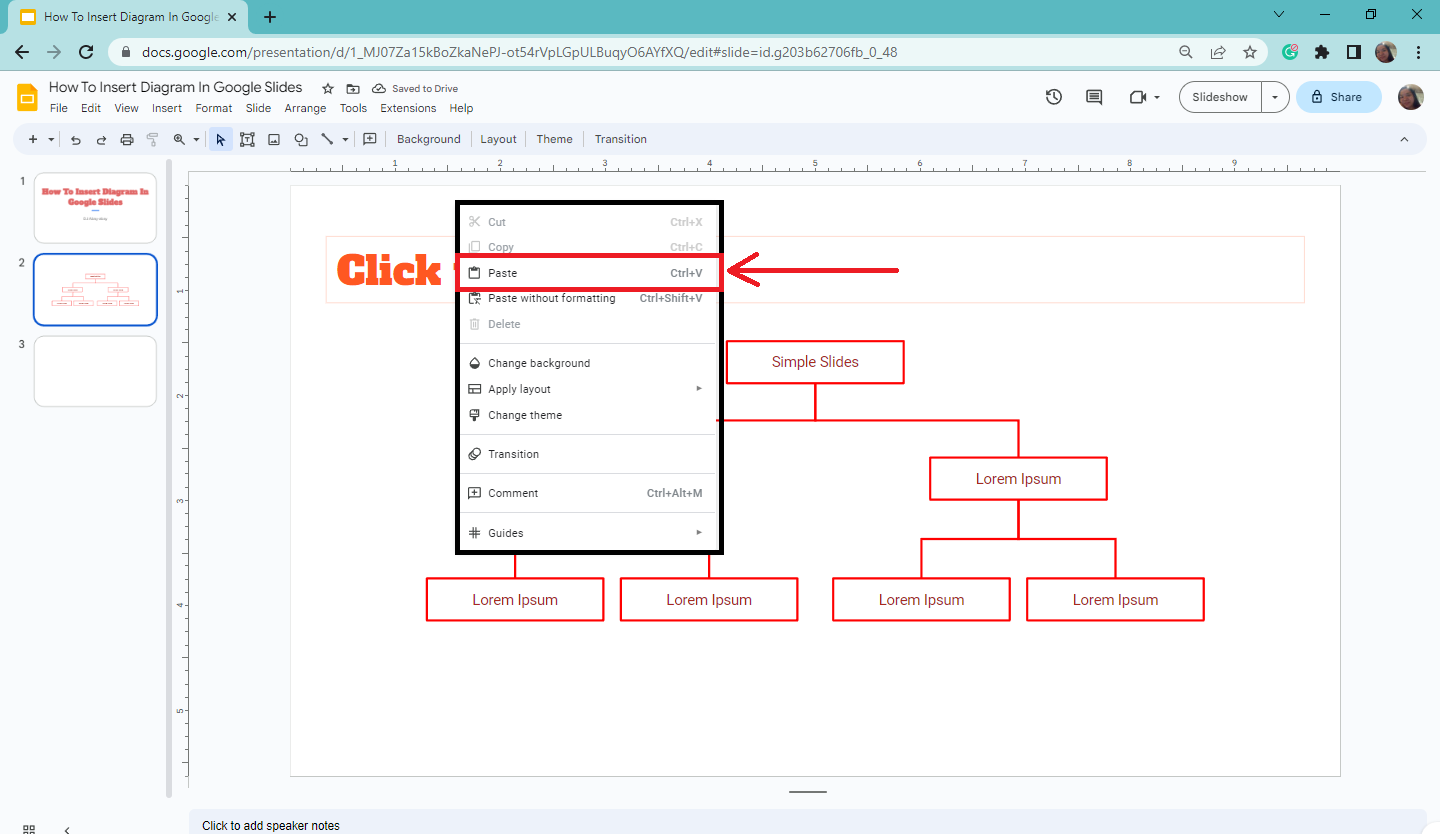
Right-click again, and then select "Paste."
-
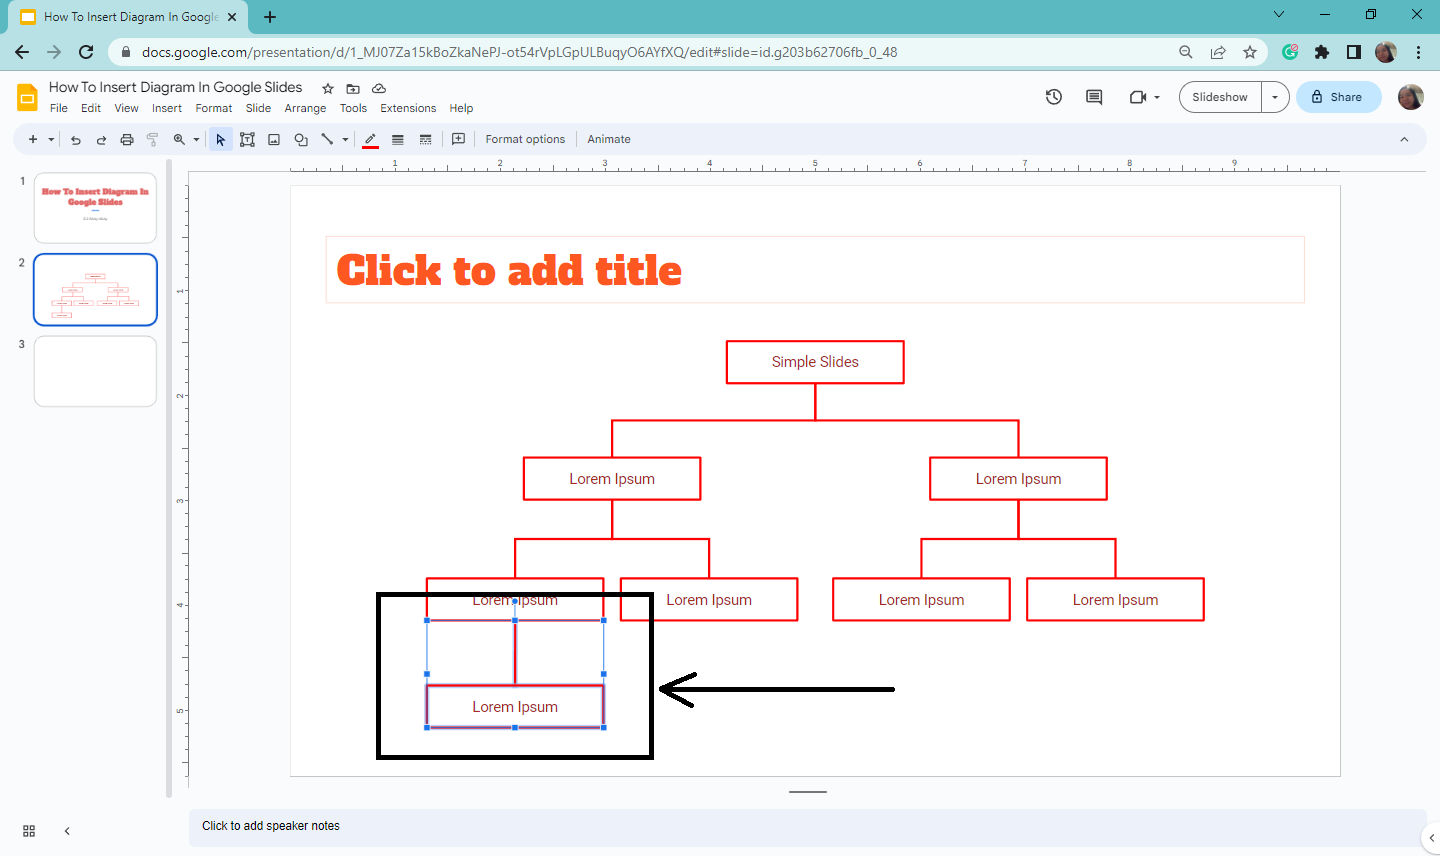
Once your connector and text box appear, you can drag and arrange the connector to your desired position.
You can press Ctrl+C to copy and Ctrl+P to paste elements in your Google Slides presentation.
Final Thoughts on How to Insert Diagrams in Google Slides
To create a new diagram for your next Google Slides presentation, follow the quick and easy step-by-step guides above!
However, if you're in a hurry and need awesome pre-made infographics for your presentation, check out Simple Slides. Access our customizable templates, slides, and infographics for your Google Slides or Microsoft PowerPoint presentations.
Frequently Asked Questions About How to Insert a Diagram in Google Slides Presentation.
What are the different types of premade diagrams and charts available in Google Slides?
Only six diagrams are available in Google Slides: Grid, Hierarchy, Timeline, Process, Relationship, and Cycle. At the same time, only four chart types are available in Google Slides bar charts, column charts, line charts, and Pie charts. You can add lucid chart diagrams for more charts and diagrams in Google Sheets and Google Docs.
Where are the diagram options located in Google Slides?
You can locate it in the "Insert" tab section of your Google Slides. Once you click the "Insert" tab, a drop-down menu opens; navigate to "Diagram" right under the "Chart" option.
What is the difference between charts and diagrams?
The difference between charts and diagrams is Charts are any form of graphical representation of data, while a diagram represents data when one of the variables is categorical.

Related Articles:
How To Add Equations To Google Slides in 6 Easy Steps
How To Reuse Slides In Google Slides: A Step-By-Step Guide
Learn How To Insert Icons In Google Slides In 8 Simple Steps!
Get A Free Sample of Our Award-Winning PowerPoint Templates + University
Get A Free Sample of Our Award-Winning PowerPoint Templates + University
Join our mailing list to receive the latest news and updates from our team.
Don't worry, your information will not be shared.
We hate SPAM. We will never sell your information, for any reason.