3 Steps to Creating the Perfect Iceberg Template
Feb 27, 2022
The iceberg metaphor gets used in presentations all the time.
Iceberg diagrams are an excellent visual piece that you can use to help explain aspects of your presentation. However, this only works if you create the perfect iceberg template. If you carelessly copy and paste an example diagram from Google or attempt to draw your own, it could end in catastrophe.
This article will explain iceberg templates in more detail and take you through the three essential steps you need to take to create the perfect iceberg PowerPoint template.
Frequently Asked Questions about Iceberg Templates:
What is an iceberg diagram?
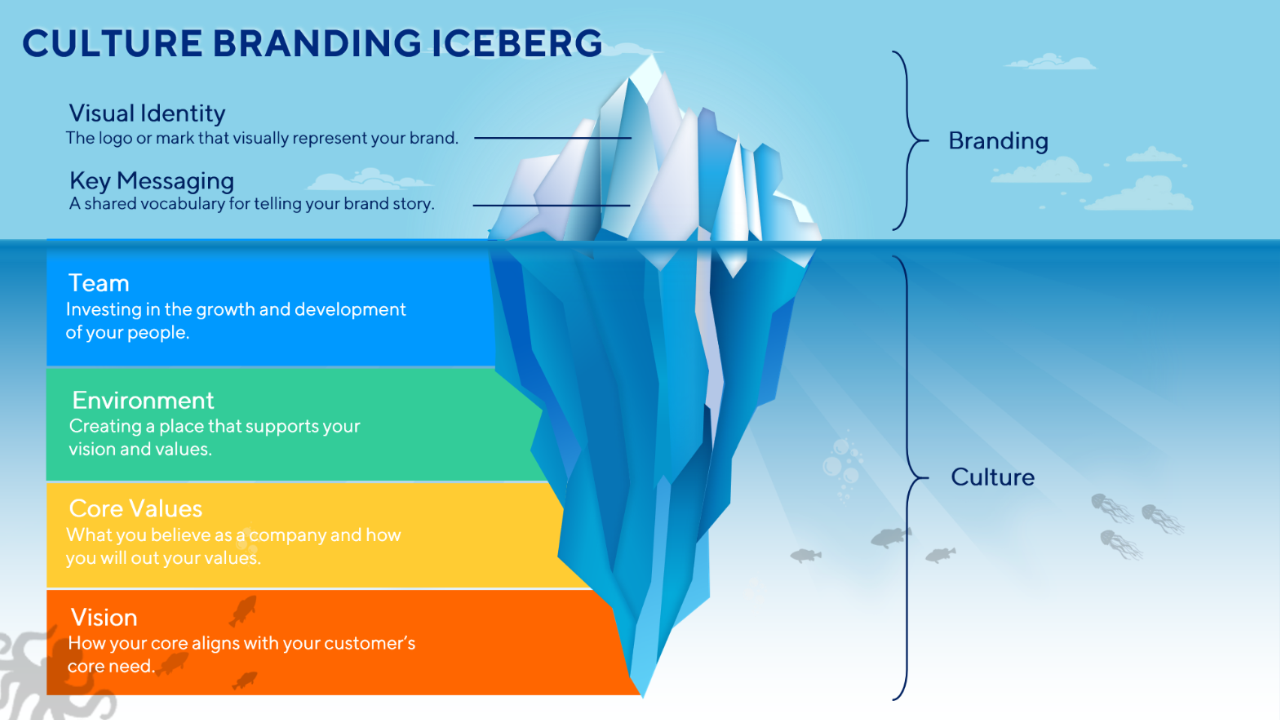
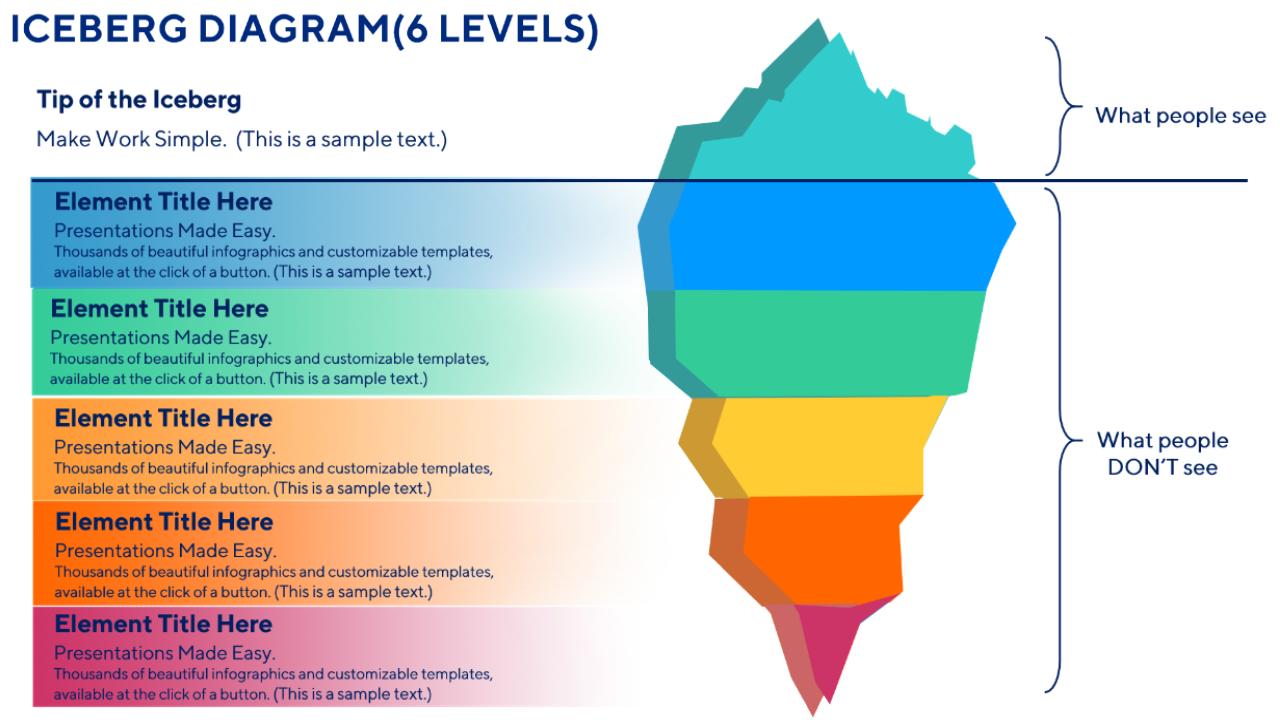
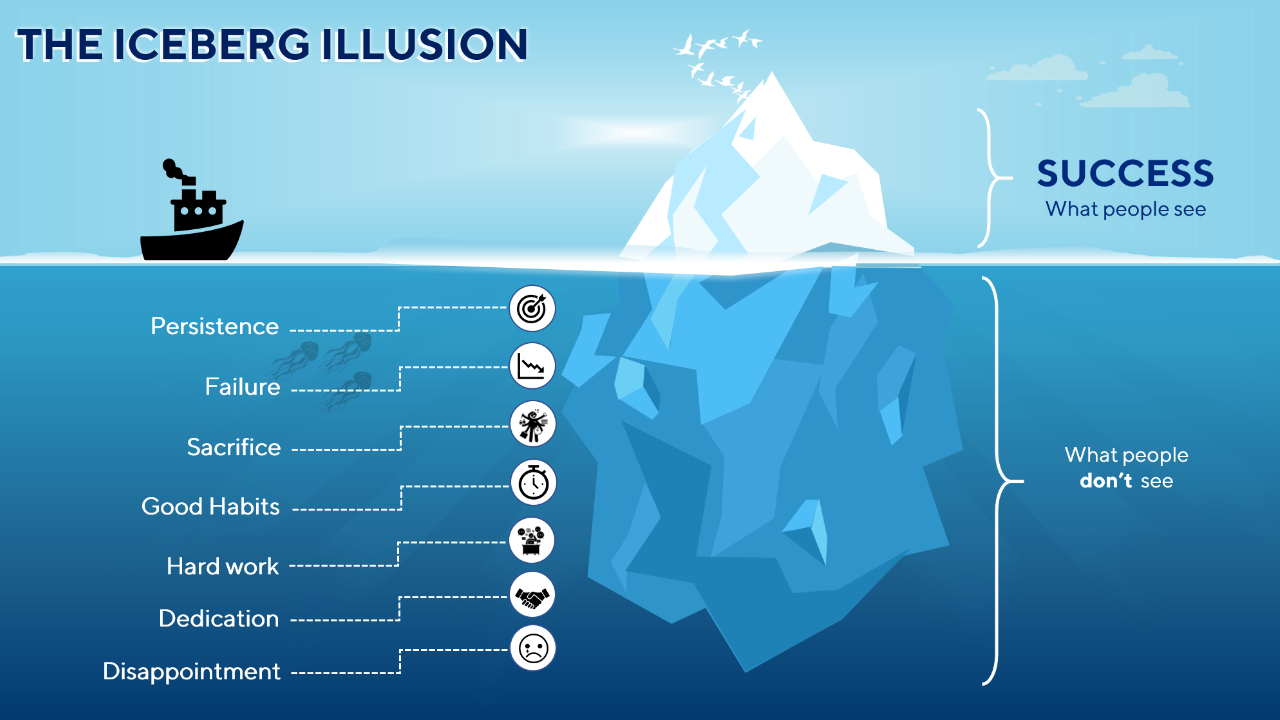
The iceberg metaphor has been used for many years, and it is an excellent way to explain various situations where events or actions are going on that people can't see (e.g., under the surface).
An iceberg diagram is an excellent visual representation of that metaphor, and iceberg infographics can be a great addition to any business presentation.
Where does the iceberg metaphor come from?
The iceberg theory was coined by an American writer called Ernest Hemingway. Since then, it has been used in business models, academic presentations, and anywhere it could enhance a presentation or pitch.
Why do people use iceberg PowerPoint templates?
Iceberg templates are an excellent option for adding visual cues and aesthetically pleasing PowerPoint slides to their presentation.
Where can I find the best iceberg PowerPoint templates?
For the best iceberg PowerPoint templates, head to the Simple Slides iceberg templates page and use your free trial to find your favorite!
The Benefits of Iceberg PowerPoint Templates
The iceberg metaphor is great for visually supporting content
For years, business presentations have attempted to use iceberg metaphors to show their ideas to potential clients or investors. However, their Microsoft PowerPoint template was likely hard to follow or understand without high-quality iceberg templates.
Using the perfect iceberg PowerPoint template that utilizes iceberg diagrams clearly and concisely can be an extremely beneficial visual aid for any PowerPoint presentation.
An iceberg diagram is easy to understand
If you use the suitable iceberg PowerPoint template, the content is straightforward. Iceberg diagrams are an excellent choice for visually representing points you want to make in your presentation.
One of the most important aspects of any PowerPoint presentation is ensuring your content is simple to digest. The more difficult it is to digest, the less likely your audience will remain engaged.
That is why it is so important to choose the iceberg PowerPoint template, with iceberg slides and iceberg infographics that are relevant and easy to understand.

The iceberg metaphor is widely understood.
Another benefit of implementing an iceberg template within a Microsoft PowerPoint presentation is that the iceberg metaphor is widely understood.
Therefore, using iceberg PowerPoint templates ensures that at least most of your audience will understand your reference.
High-quality iceberg infographics in college or business presentations are easy to follow, even if your audience has never heard of the metaphor.
How to Create the Perfect Iceberg PowerPoint Template
Step #1: Plan out your presentation
Before you go any further, you need to map out your presentation. It's all well and good selecting an iceberg PowerPoint. Still, if you aren't sure how to implement your iceberg diagrams within the display, you will struggle to make an excellent presentation.
For example, why are you using an iceberg slide rather than a pie chart? These are questions you need to answer before you start your next project.
Step #2: Consider what you want your iceberg diagram to show
Once you have mapped out your presentation and identified your iceberg slide, you need to consider what you wish your iceberg diagram to illustrate. Each iceberg model is different, so copying and pasting one online requires little effort.
However, if you go down this route, your iceberg model will likely not perfectly represent the points you are trying to make.
Instead, choose an iceberg PowerPoint from our library of options with an iceberg model that perfectly suits your goals.
Step #3: Decide when will your iceberg diagram be the most powerful
Once you have picked the perfect iceberg template for your presentation, it is time to identify where the infographic should sit for maximum effect.
Do you want to use it at the start of your PowerPoint, to use it as the focal point while you are presenting? Maybe you want to feature it at the presentation's opening and loop back once you have finished?
Or perhaps your iceberg infographic will be better suited in the middle of your presentation to help you clarify one particular concept from the display.
If used correctly, an iceberg graphic is an excellent substitute for slides packed with confusing data and bland graphics.
Related Articles:
Get A Free Sample of Our Award-Winning PowerPoint Templates + University
Get A Free Sample of Our Award-Winning PowerPoint Templates + University
Join our mailing list to receive the latest news and updates from our team.
Don't worry, your information will not be shared.
We hate SPAM. We will never sell your information, for any reason.